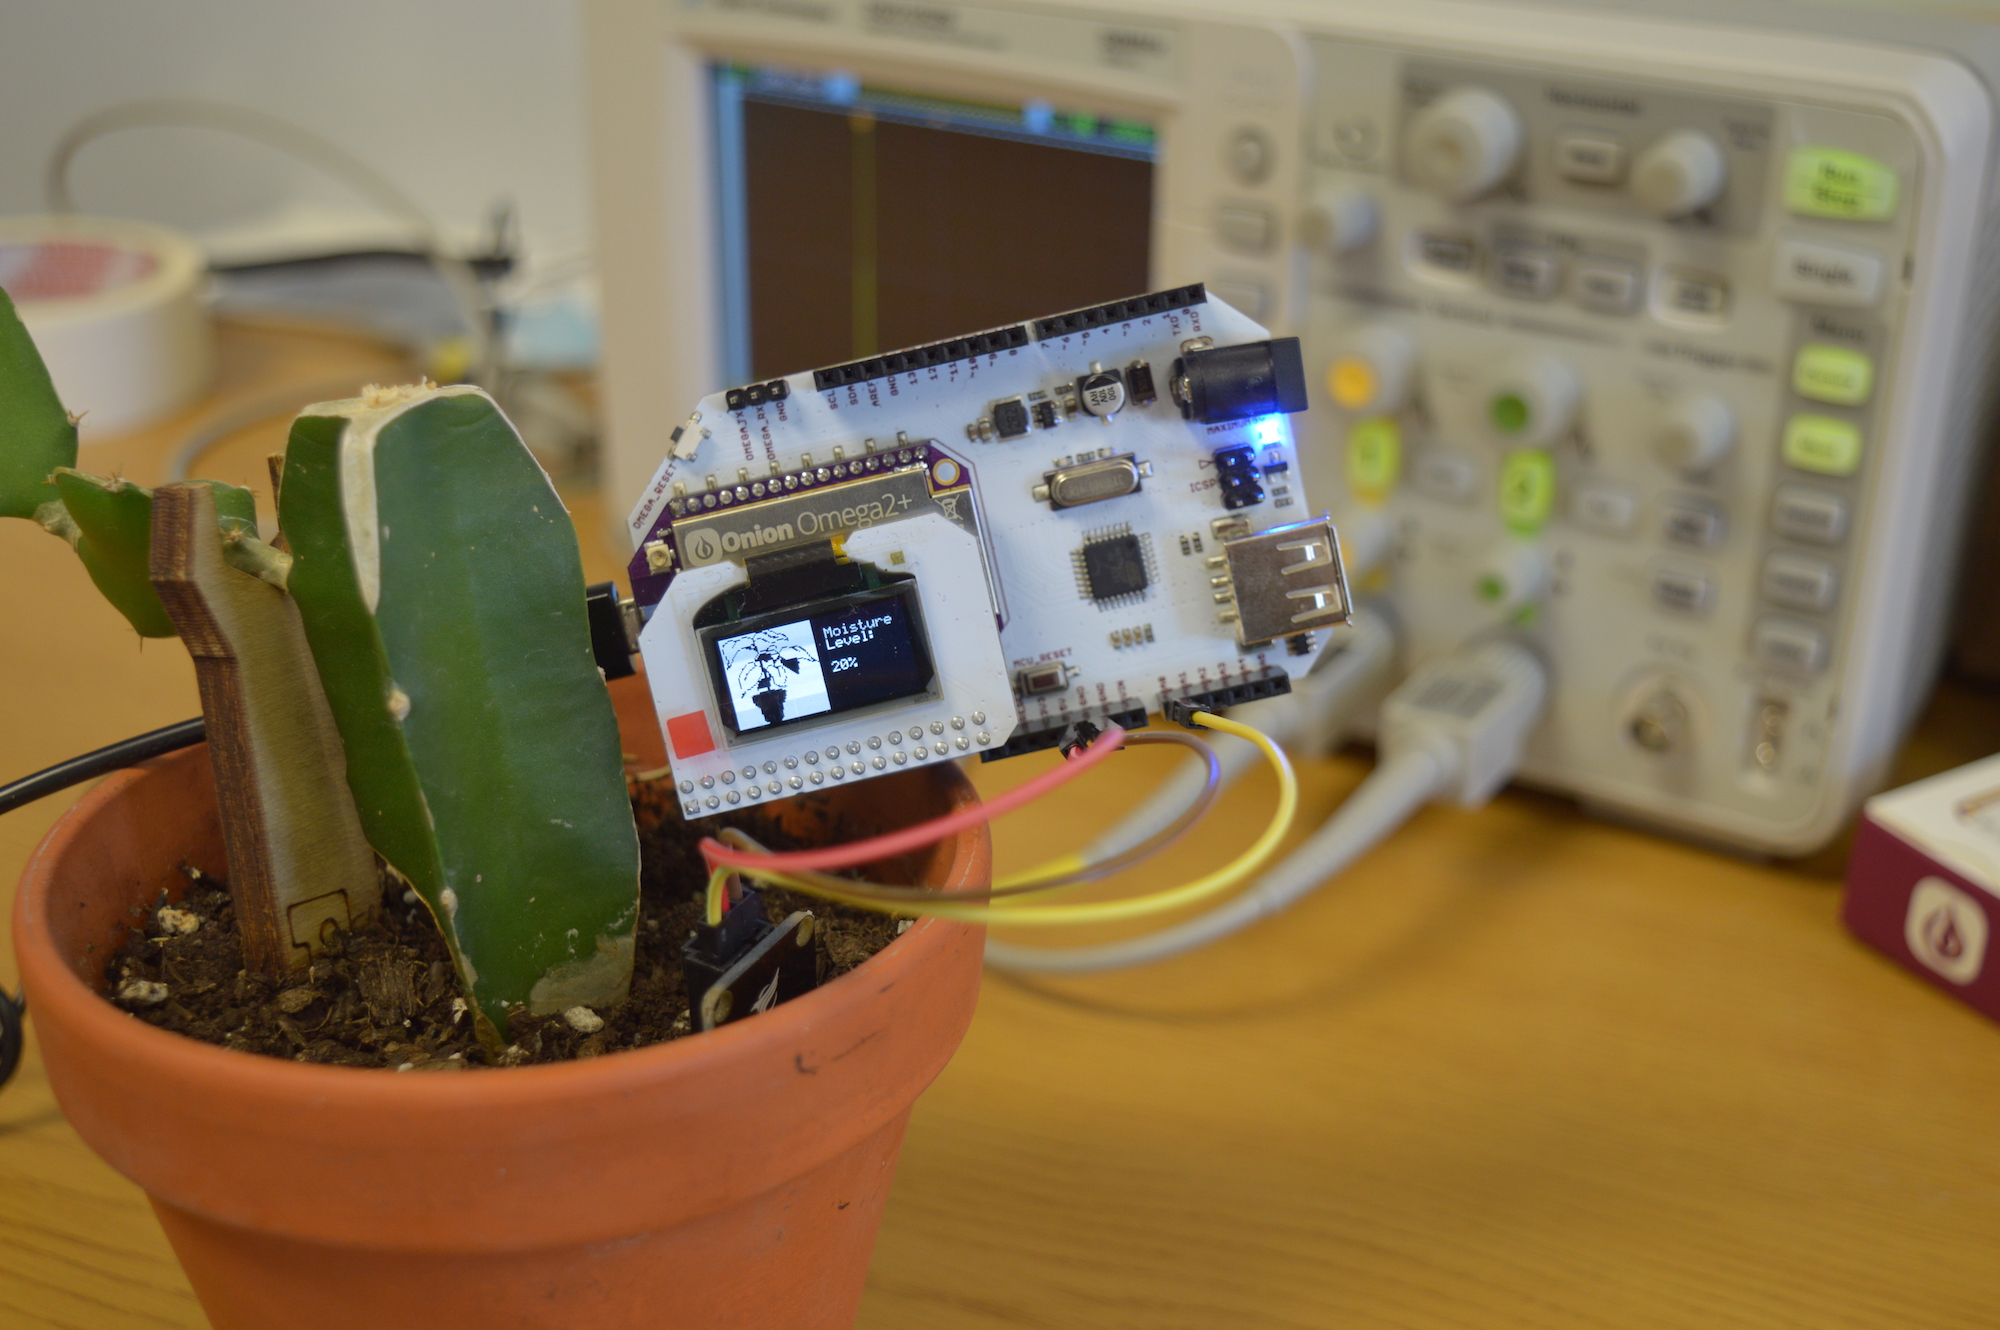
Smart Plant - Visualizing Plant Data
This is the second major part of the smart plant project! Last time, we setup an Omega to measure the soil moisture level in one of your plants. This part involves sending that data to a cloud service so we can visualize it and open the door to even more possibilities. The cloud service we will be using is the Losant IoT Platform.
Overview
Skill Level: Intermediate
Time Required: 1 hour
We’re keeping the Arduino Dock and analog soil moisture sensor from the first part. Using a command line argument, we will be activating a part of the Python program we didn’t use last time. This part of the program will use the MQTT protocol to communicate with Losant.
Losant provides a Python library, losant-mqtt, to easily interface devices with their cloud platform. Underneath, the popular paho-mqtt module is used to implement the MQTT communication. The same thing can be achieved with just paho-mqtt since the Losant module is just a wrapper for paho-mqtt, but the Losant module makes the implementation a little easier, so we’ll use it.
This project will provide a guide on setting up Losant for our purposes:
- Creating an application
- Creating a device on their platform
- Managing security with Access Keys
- Developing a basic workflow
- Setting up a Dashboard to visualize the smart plant data
It also shows how to setup an Omega to send data to Losant.
The complete project code can be found in Onion’s smart-plant repo on GitHub.
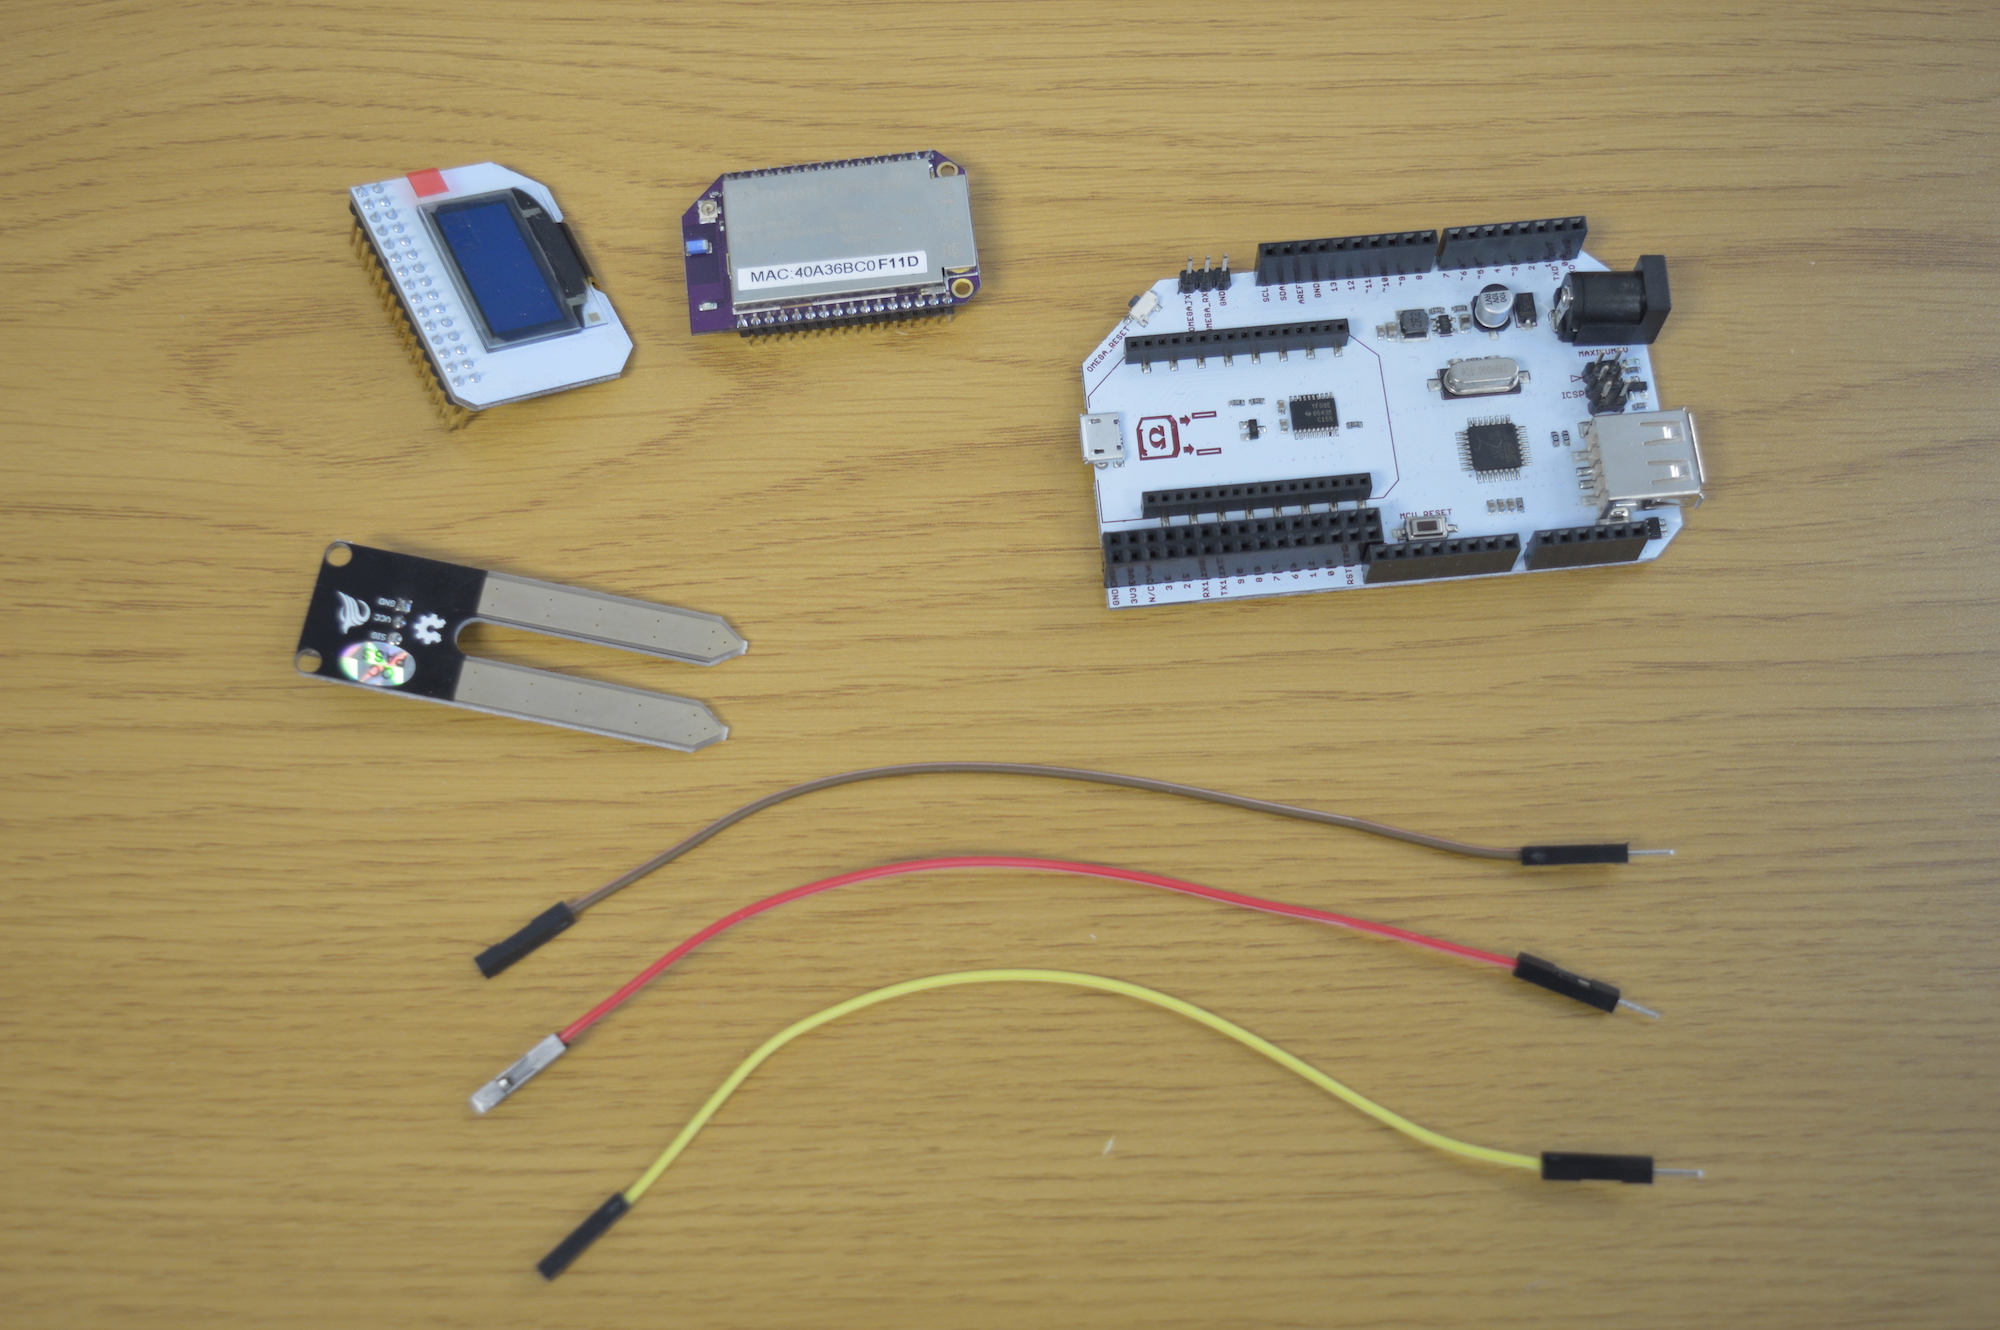
Ingredients
The same as the first part of the project:
- Onion Omega2 or Omega2+
- Onion Arduino Dock 2
- Onion OLED Expansion (optional but recommended)
- Soil Moisture Sensor
- 3x Male-to-Female Jumper Wires
Step-by-Step
Follow these instructions to set this project up on your very own Omega!
1. Prepare
You’ll have to have an Omega2 ready to go, complete the First Time Setup Guide to connect your Omega to WiFi and update to the latest firmware.
2. Complete Part 1 of the Project
This project builds on the first part of the Smart Plant project. If you haven’t already completed the first part, go back and do it now!
3. Register for Losant
Navigate to Losant.com and sign up for their free sandbox tier.
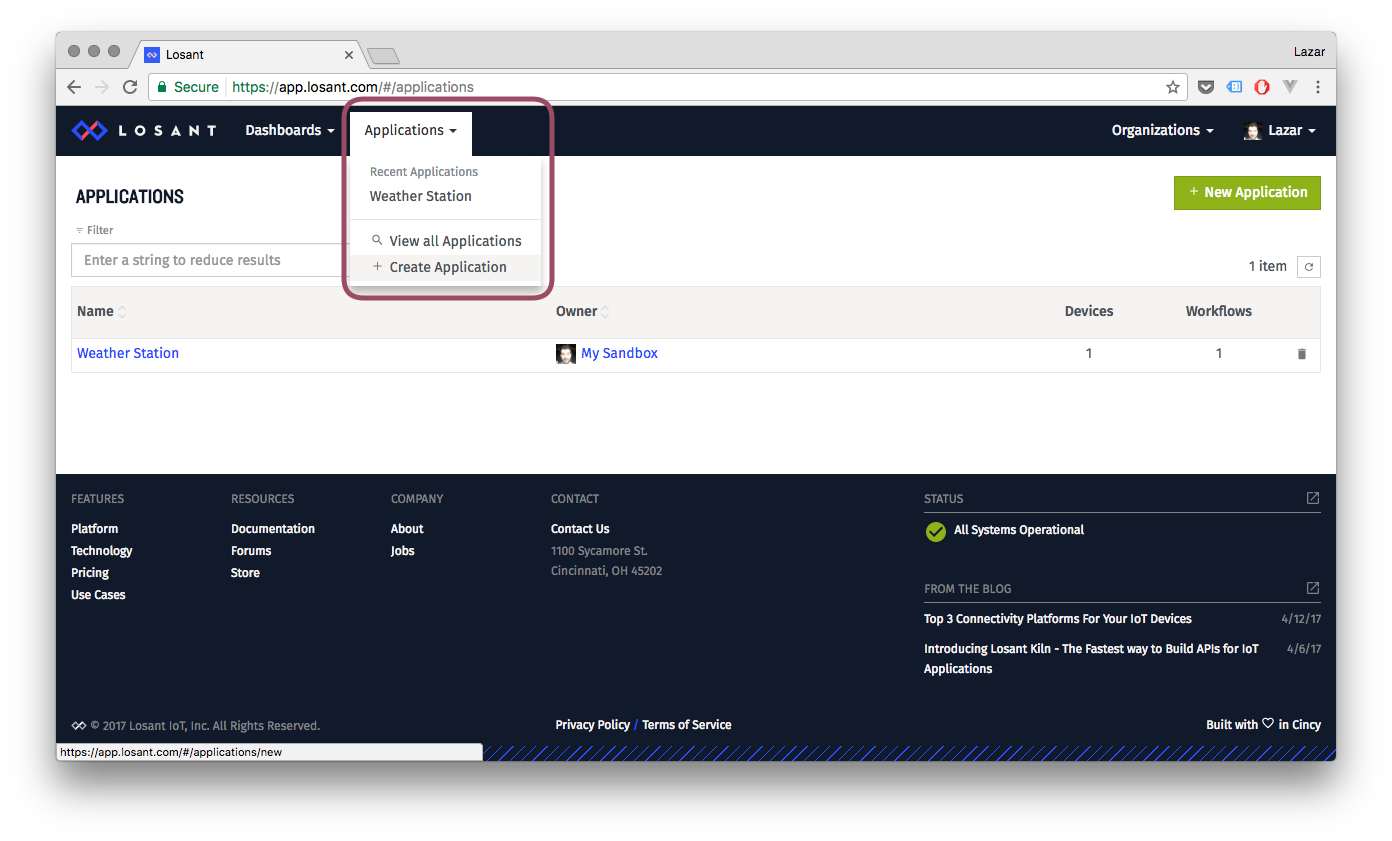
4. Create a Losant Application
You’ll first need to create a Losant Application to be able to use their IoT Platform. For more details see the Losant Application Documentation.
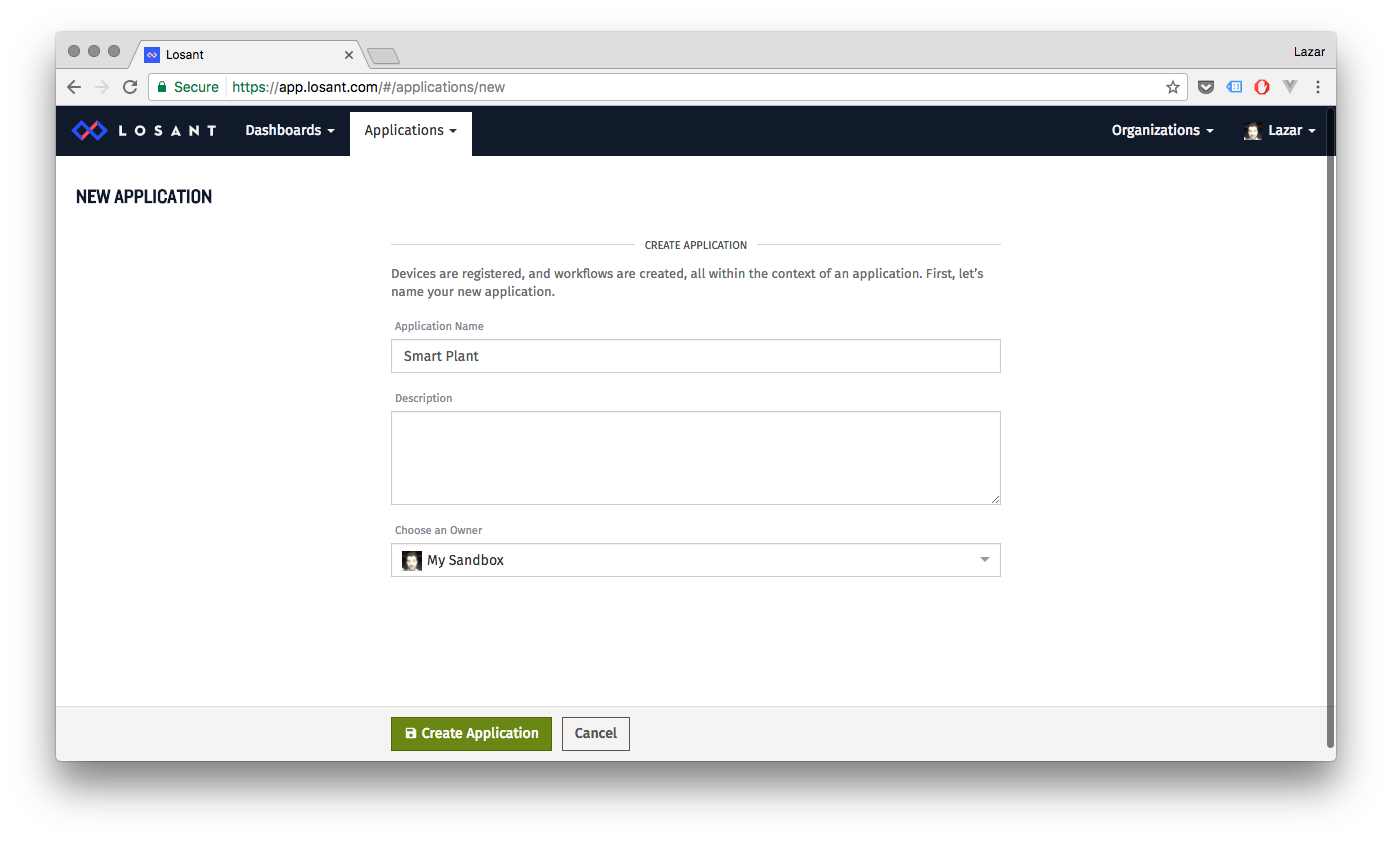
Click the Applications Menu, and then Create Application:
Give your Application a name, Smart Plant was our choice:
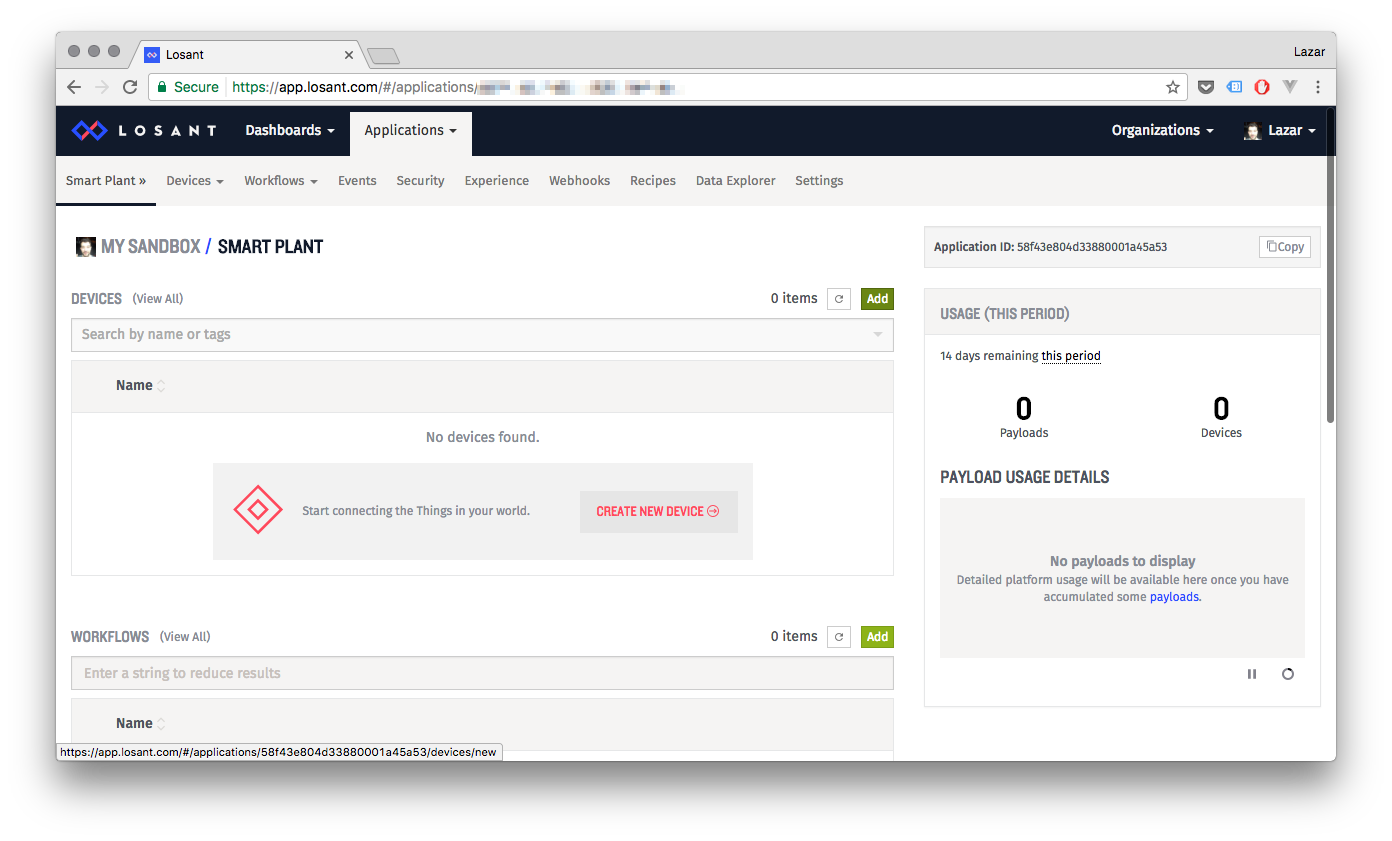
Ok, now your application is created
5. Create a Losant Device
Now that you have an Application, you’ll need to create a Device. A device on Losant can send data to the cloud and receive commands from the cloud. For more details see the Losant Device Documentation.
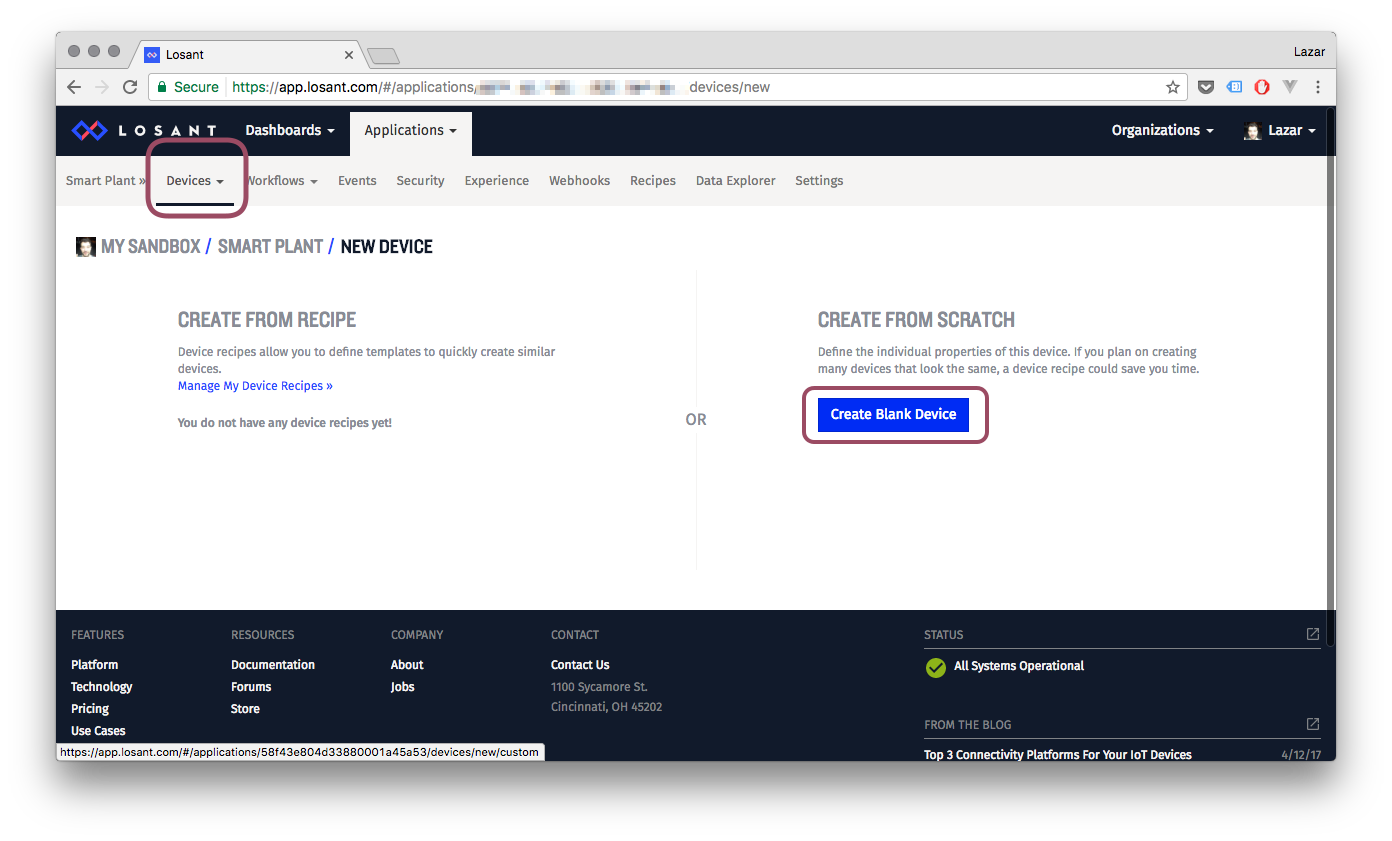
Click the Devices menu, and then Create a Blank Device:
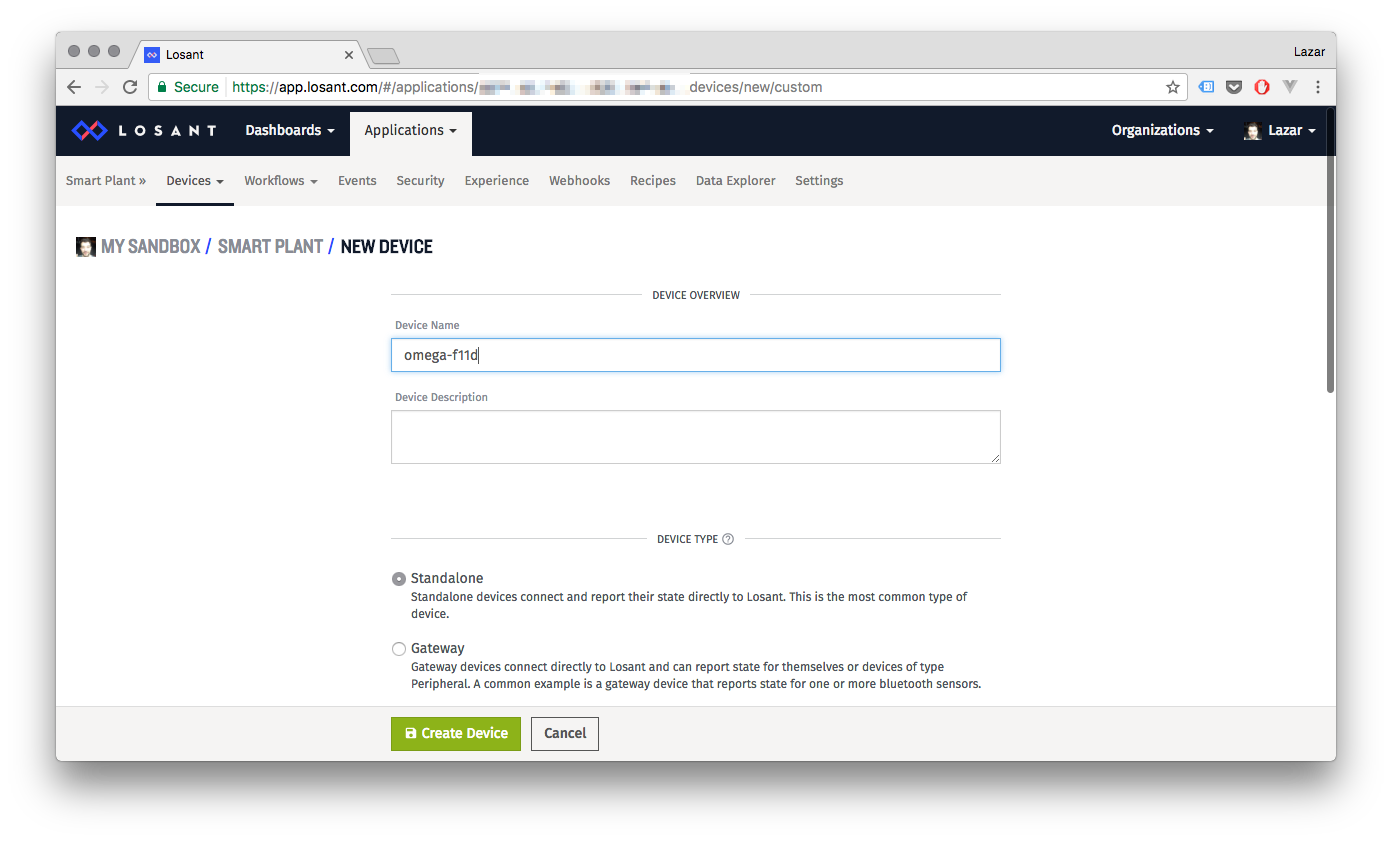
Give your device a name, we found it easiest to use the name of the Omega we’re using to measure the soil moisture levels. Make sure the Device Type is set to Standalone:
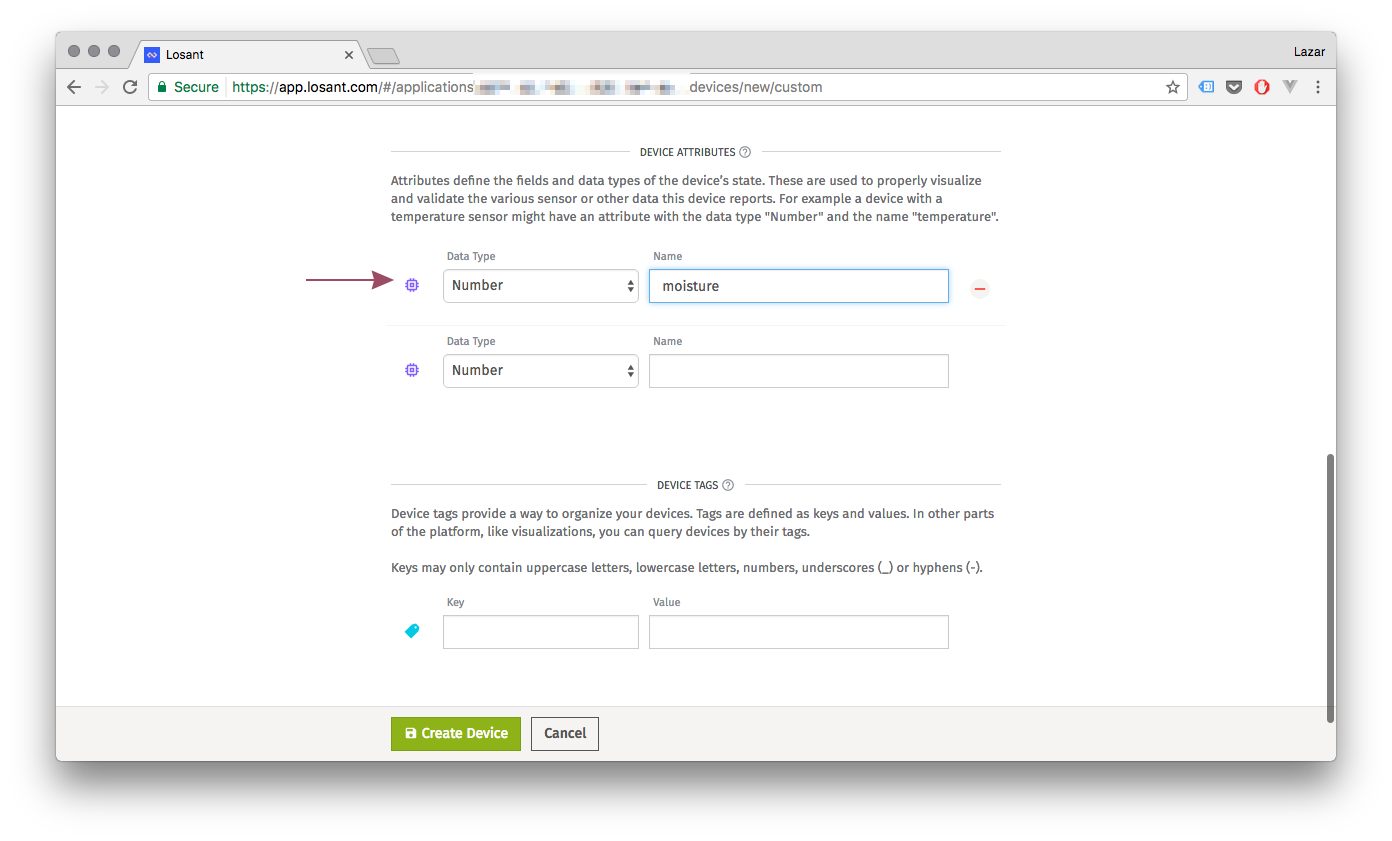
Scroll down and add a Number attribute named moisture to the device. This attribute will hold the soil moisture level data coming from your Omega:
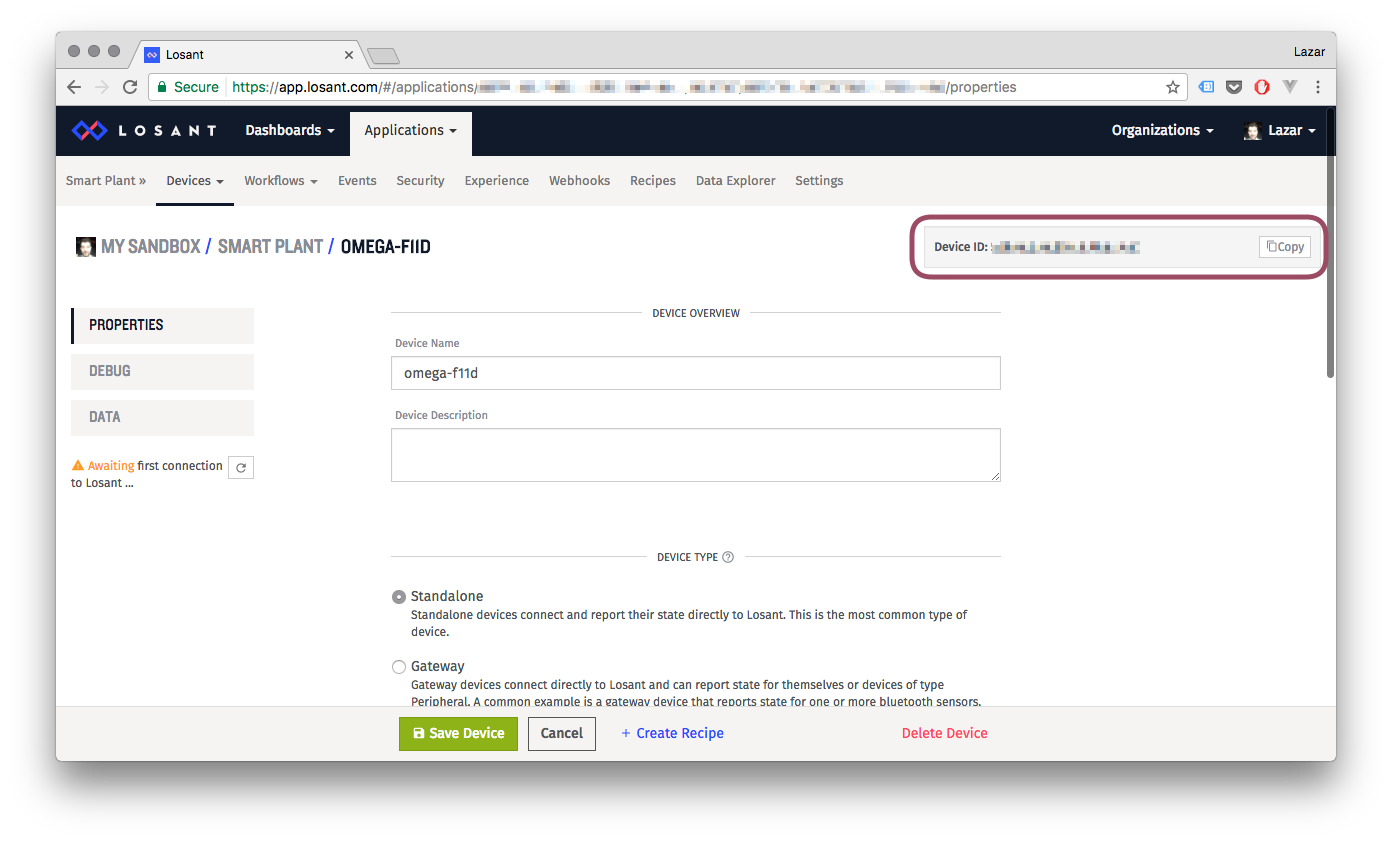
Hit Create Device and your device will be ready to go. Note the Device ID on the upper right hand side:
6. Create a Losant Access Key
To actually get your Omega to communicate with Losant, it will need to authenticate. To carry out that authentication, we’ll use an Access Key. For more details see the Losant Access Key Documentation.
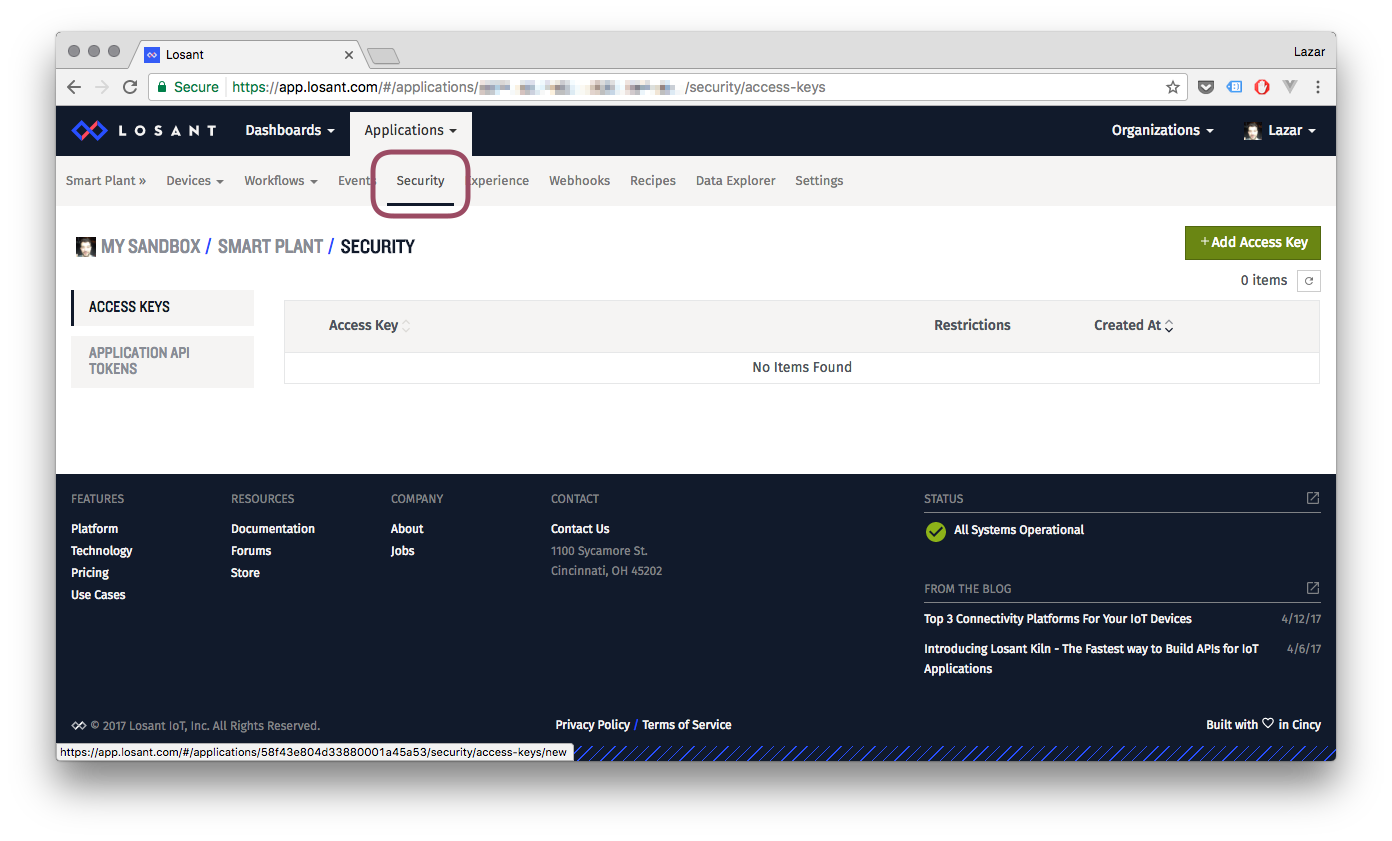
Click the Security Menu and then the Add Access Key button:
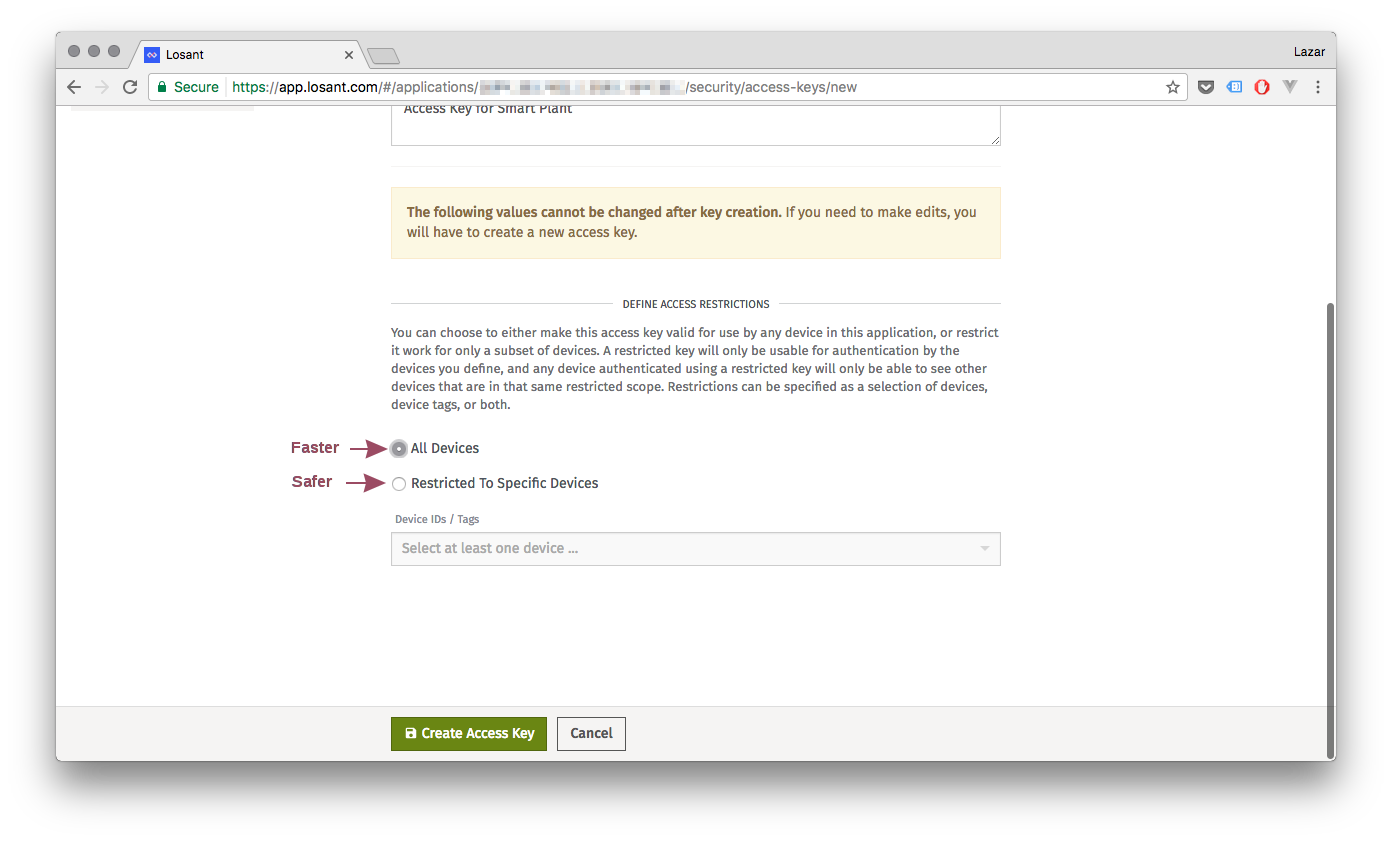
Give the key a description:
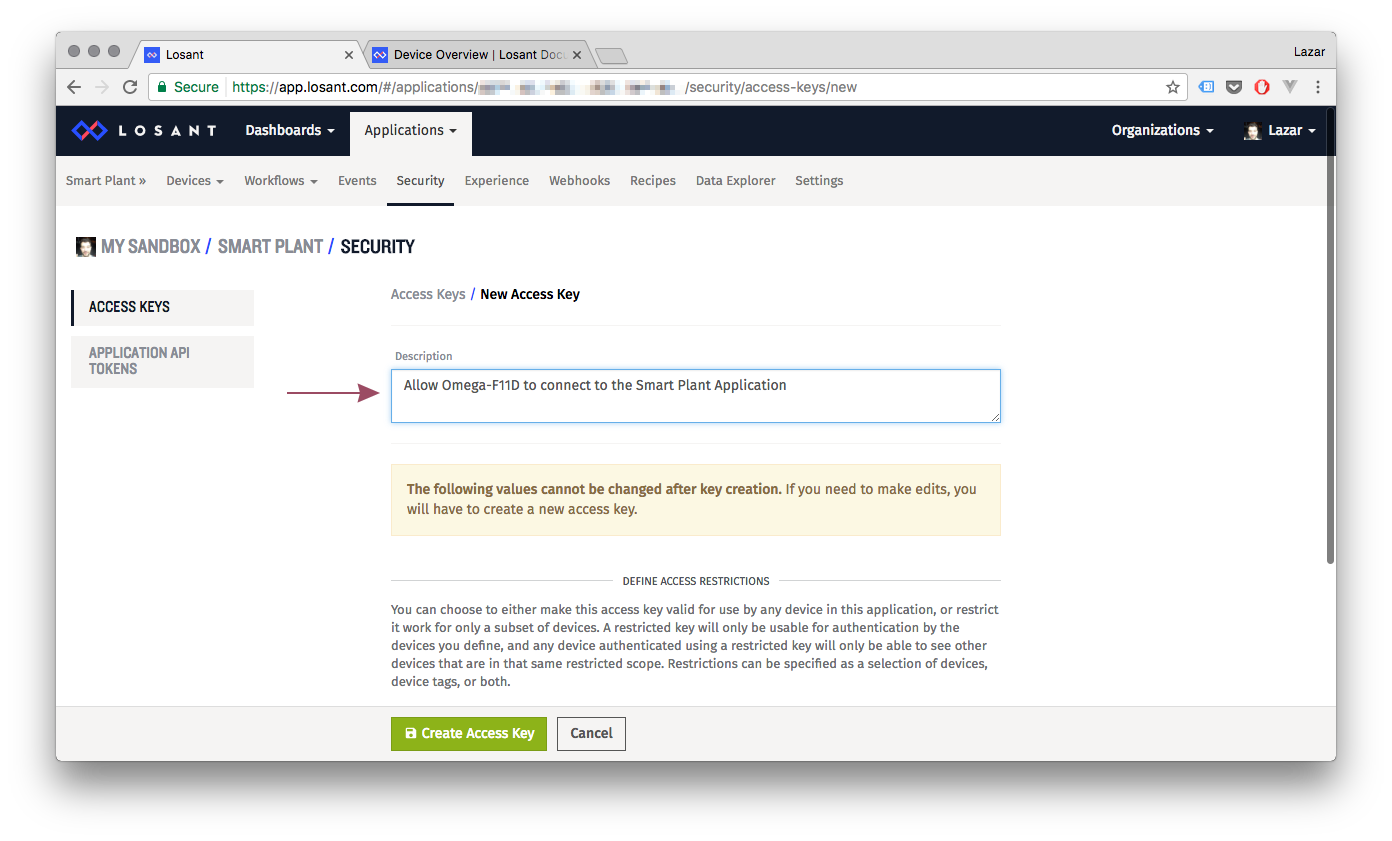
We’re setting the Key to authenticate all of our devices on Losant. This is slightly risky, if you like, you can change it so that the access key is restricted to just a single device.
In either case, hit the Create Access Key button:
The access key and secret have now been generated! Make sure to note them both down because this will be the only time you will get to see the Secret! We recommend downloading to a file.
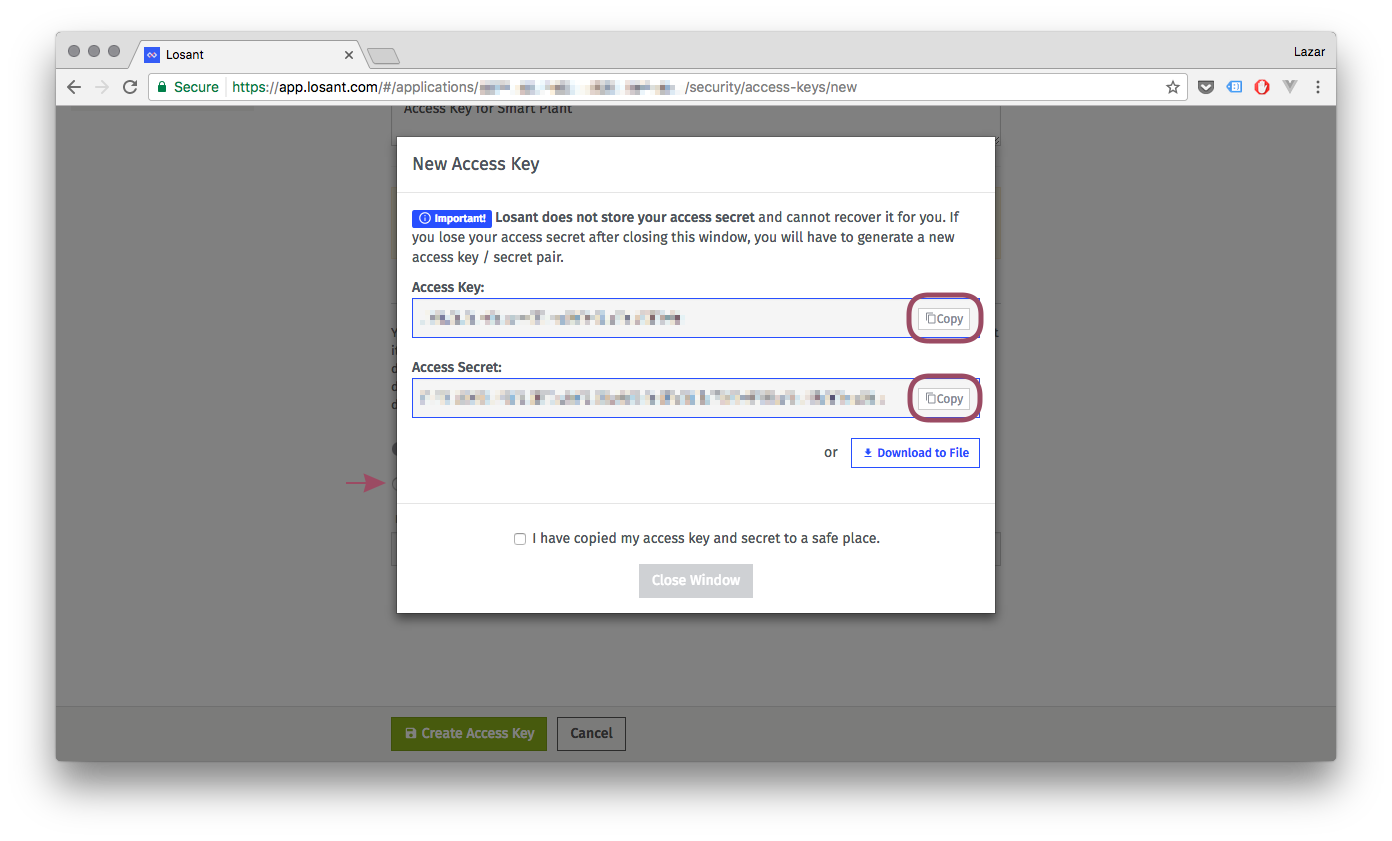
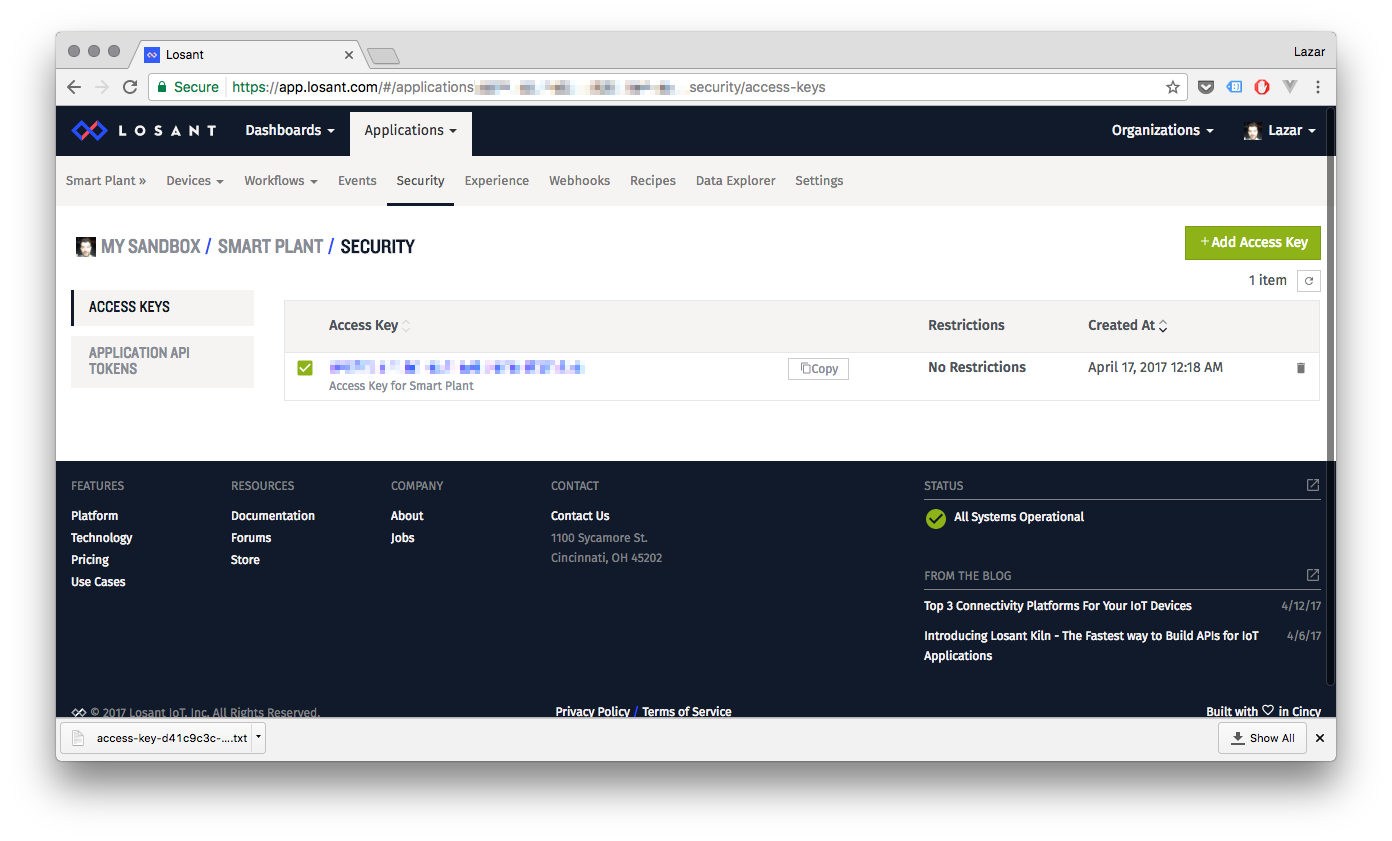
Alright! Your Access Key is ready to go!
7. Create a Losant Workflow
Now we need to make a Losant Workflow so our device can interact with the rest of Losant. For now, our workflow will be a simple tool for debugging. These workflows are easy to use and very powerful, definitely check out Losant’s workflow documentation to learn more.
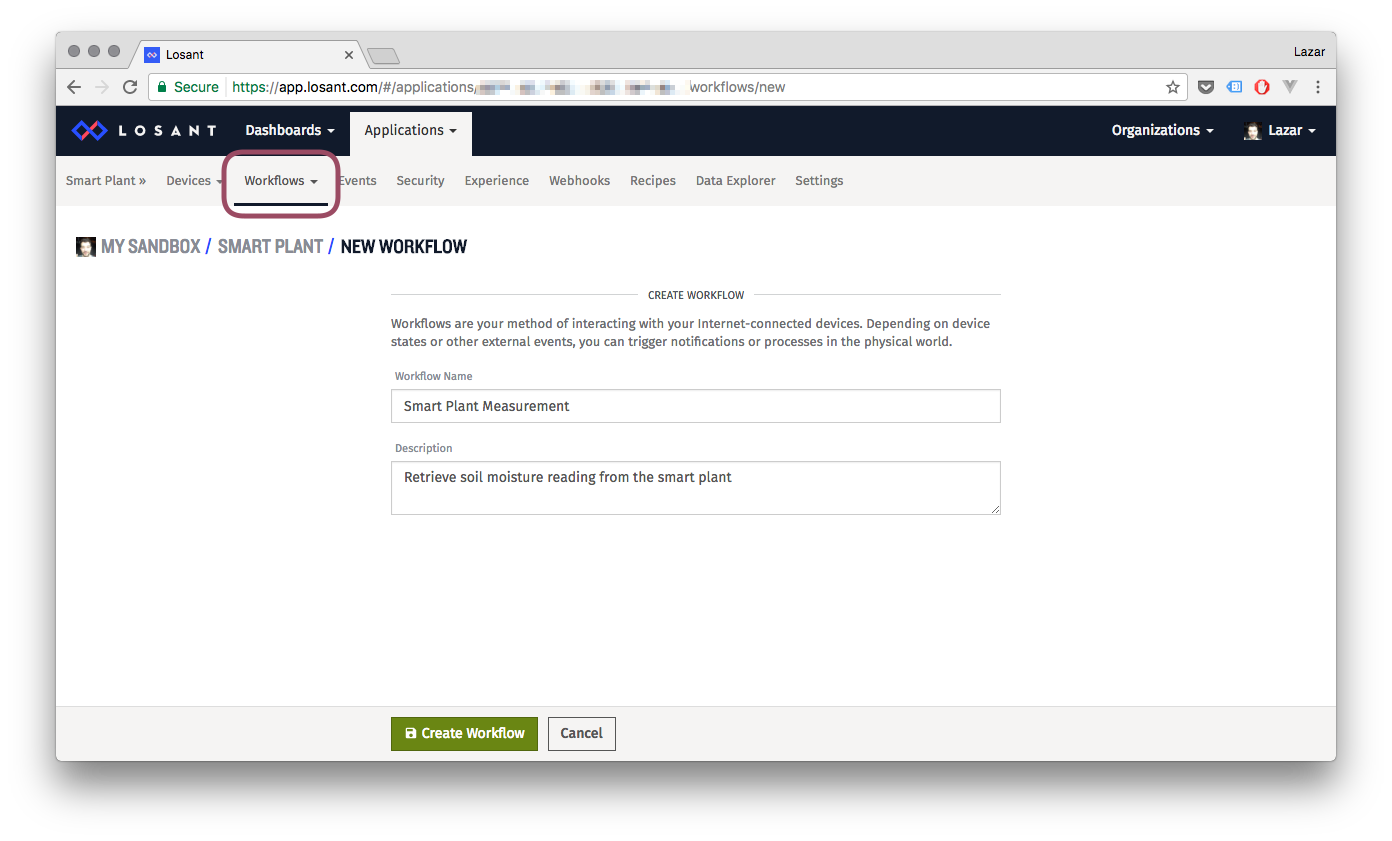
Click on the Workflows menu and then Create Workflow. Give your workflow a name and a description:
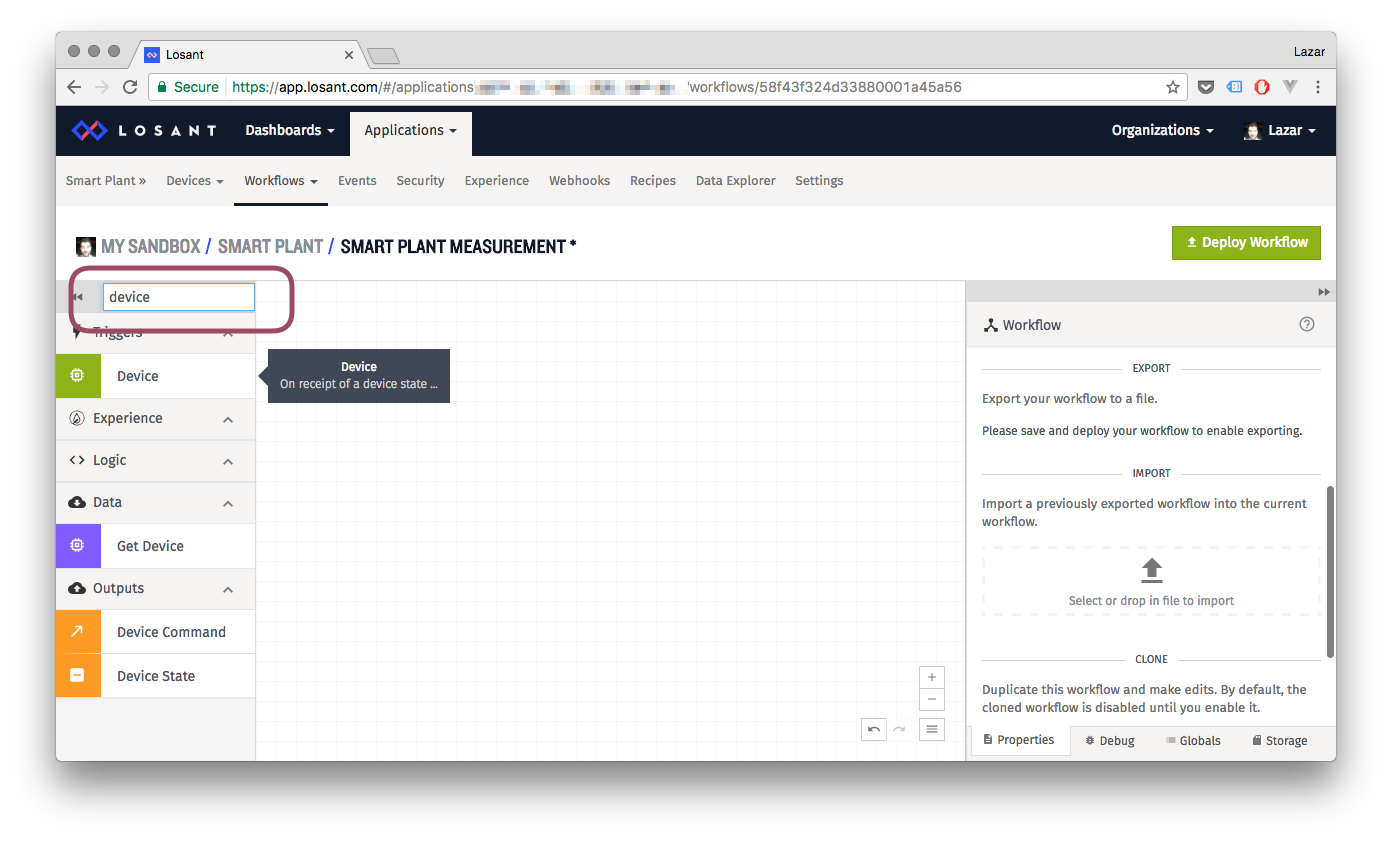
Type device into the search bar, then click and drag the Device block onto the area in the middle:
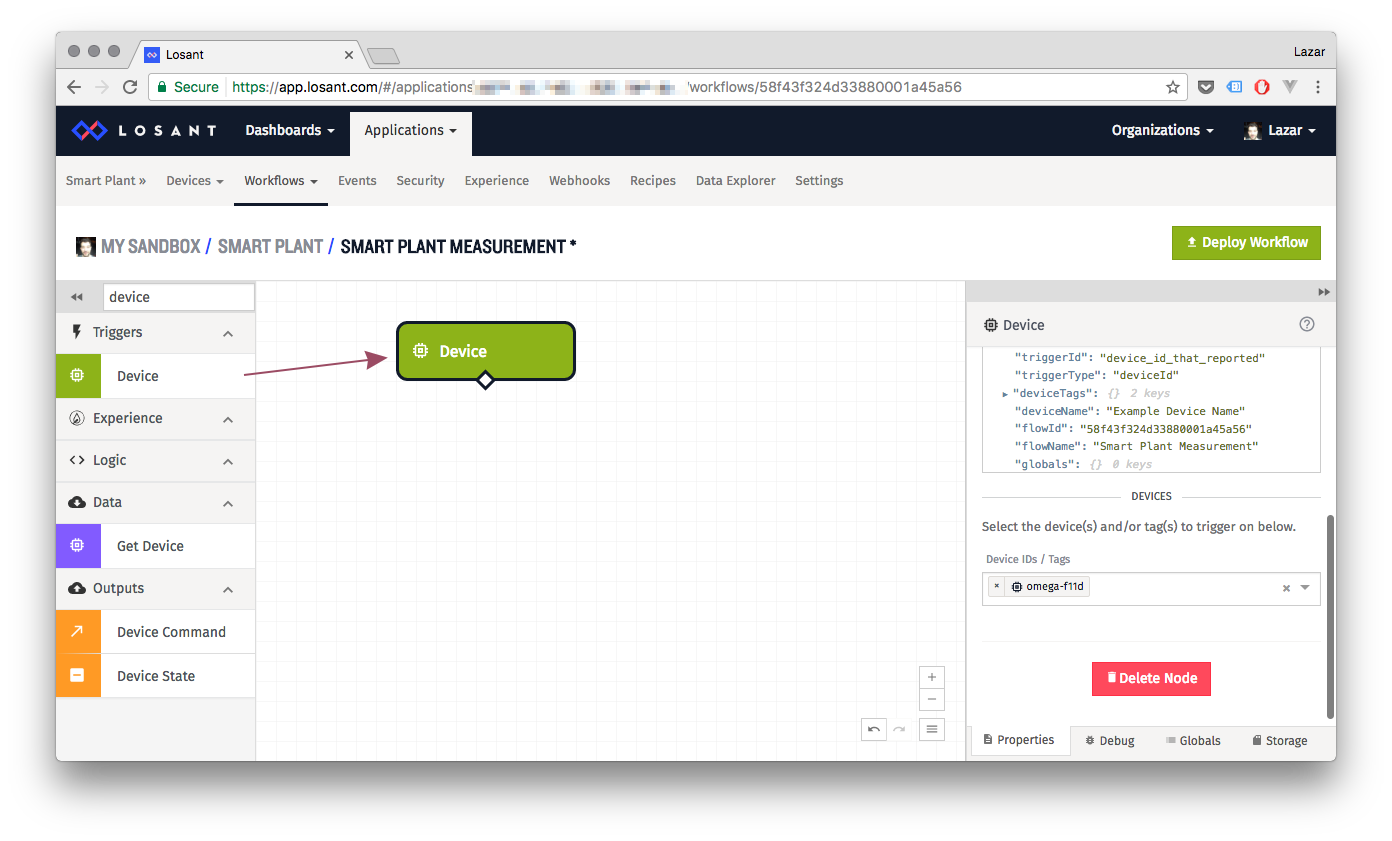
Click on the new Device block and scroll down in the right-side toolbar to select which of your devices will be associated with this Device block. You’ll want to select the device you just created:
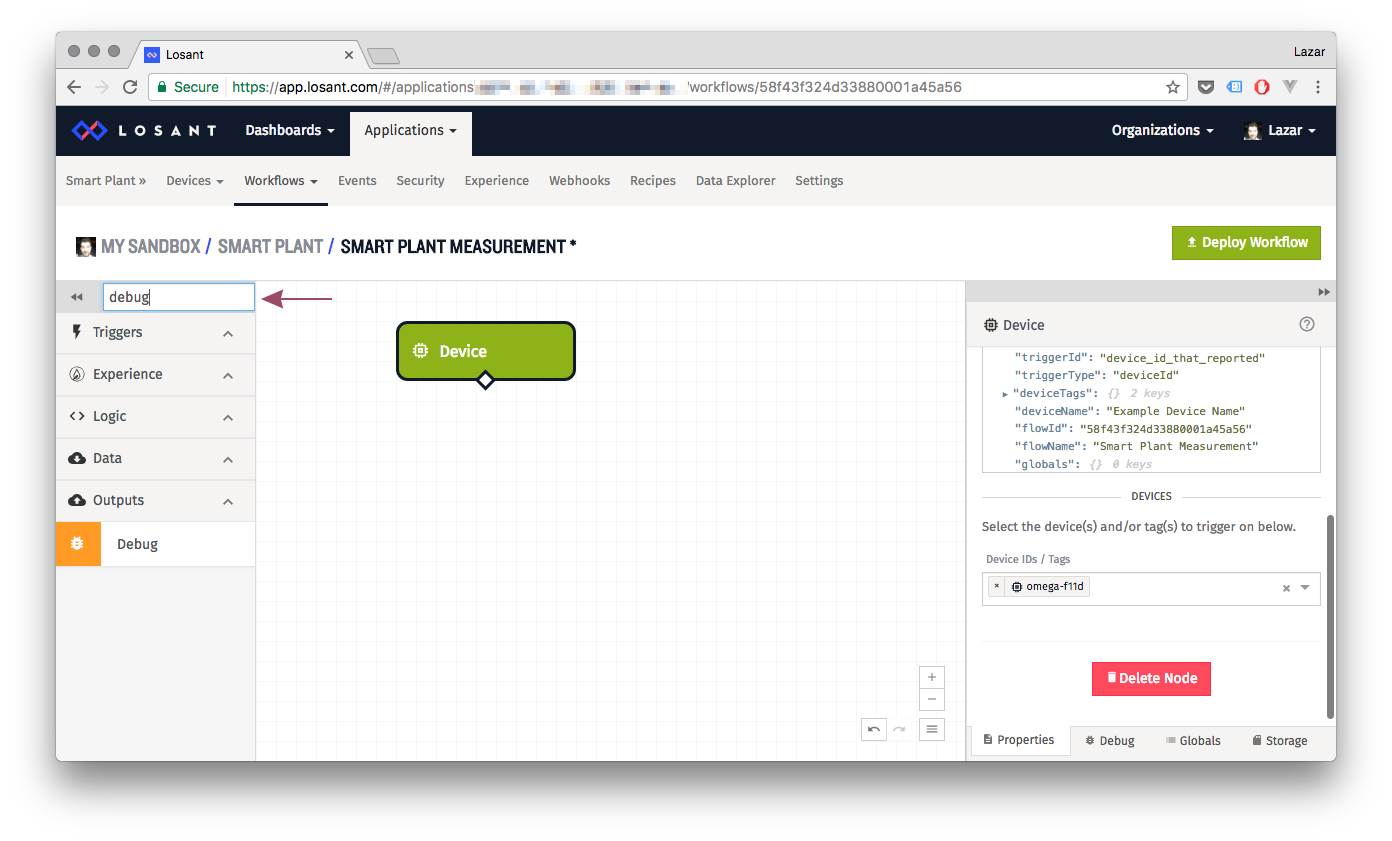
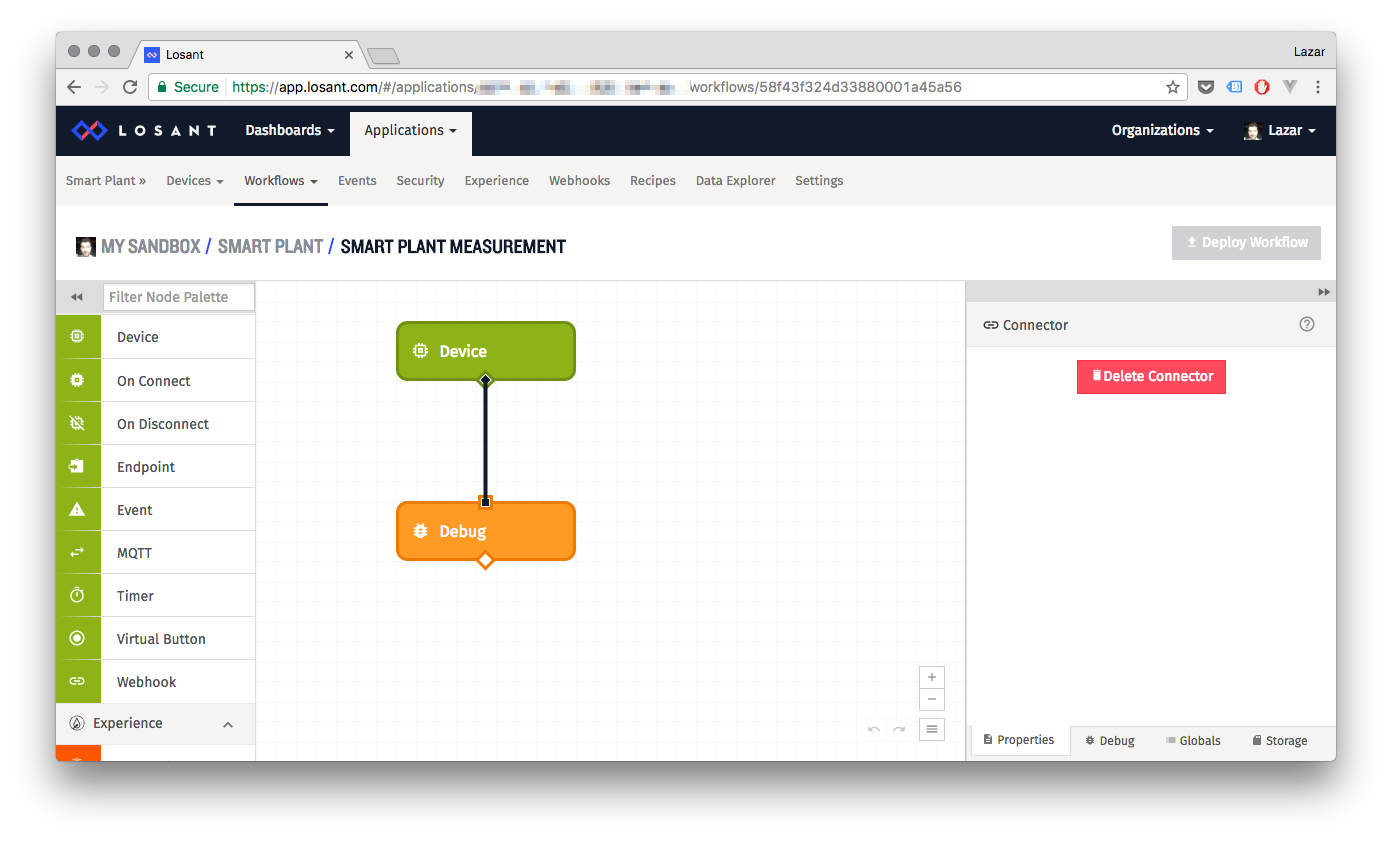
Now, let’s add a Debug box so we can view the data coming from our device. Type debug into the search box:
Drag the Debug block into the area in the middle:
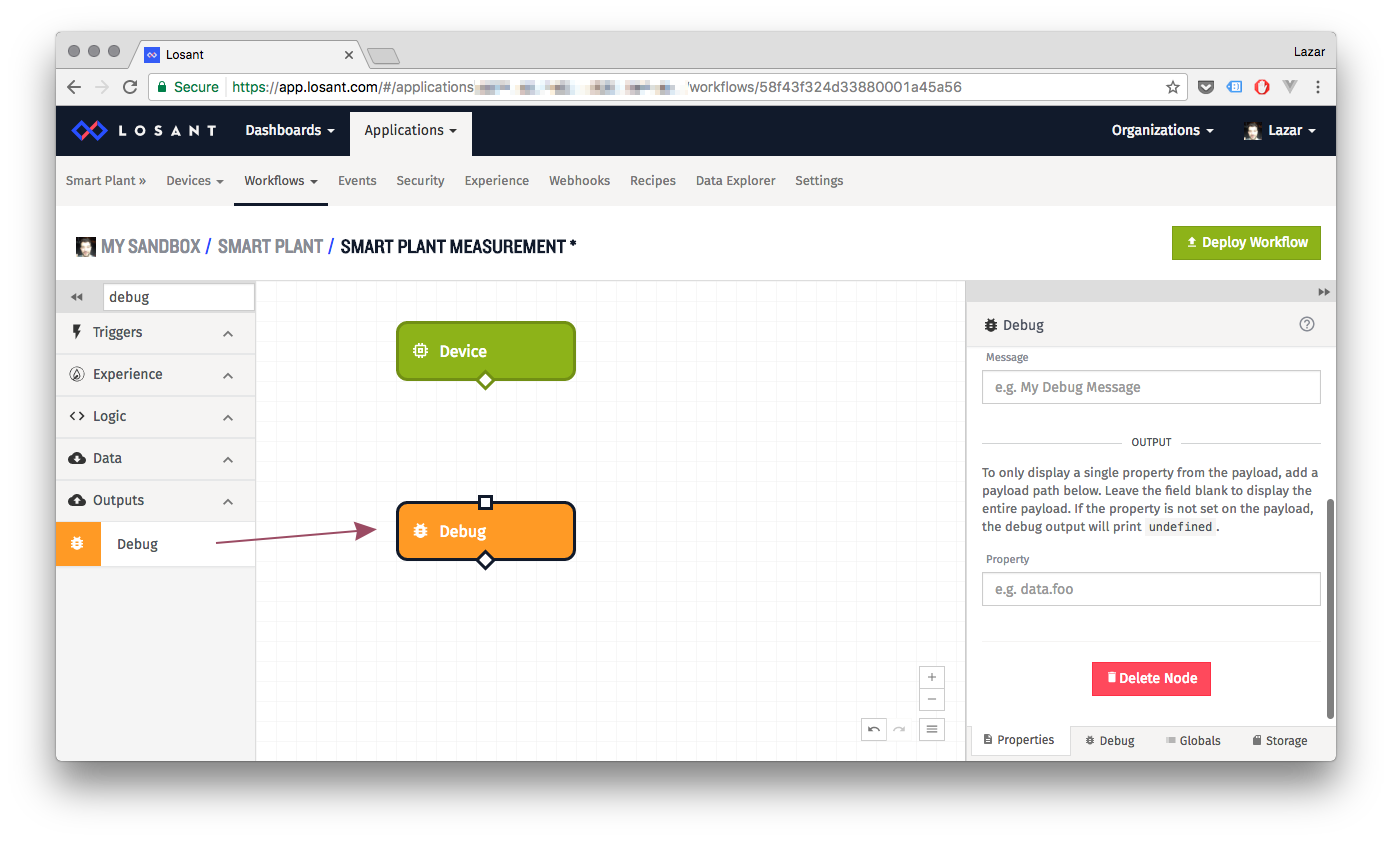
We now need to connect the two blocks. Click on the diamond at the bottom of the Device block and drag it down to the square at the top of the Debug block, and then hit the Deploy Workflow button:
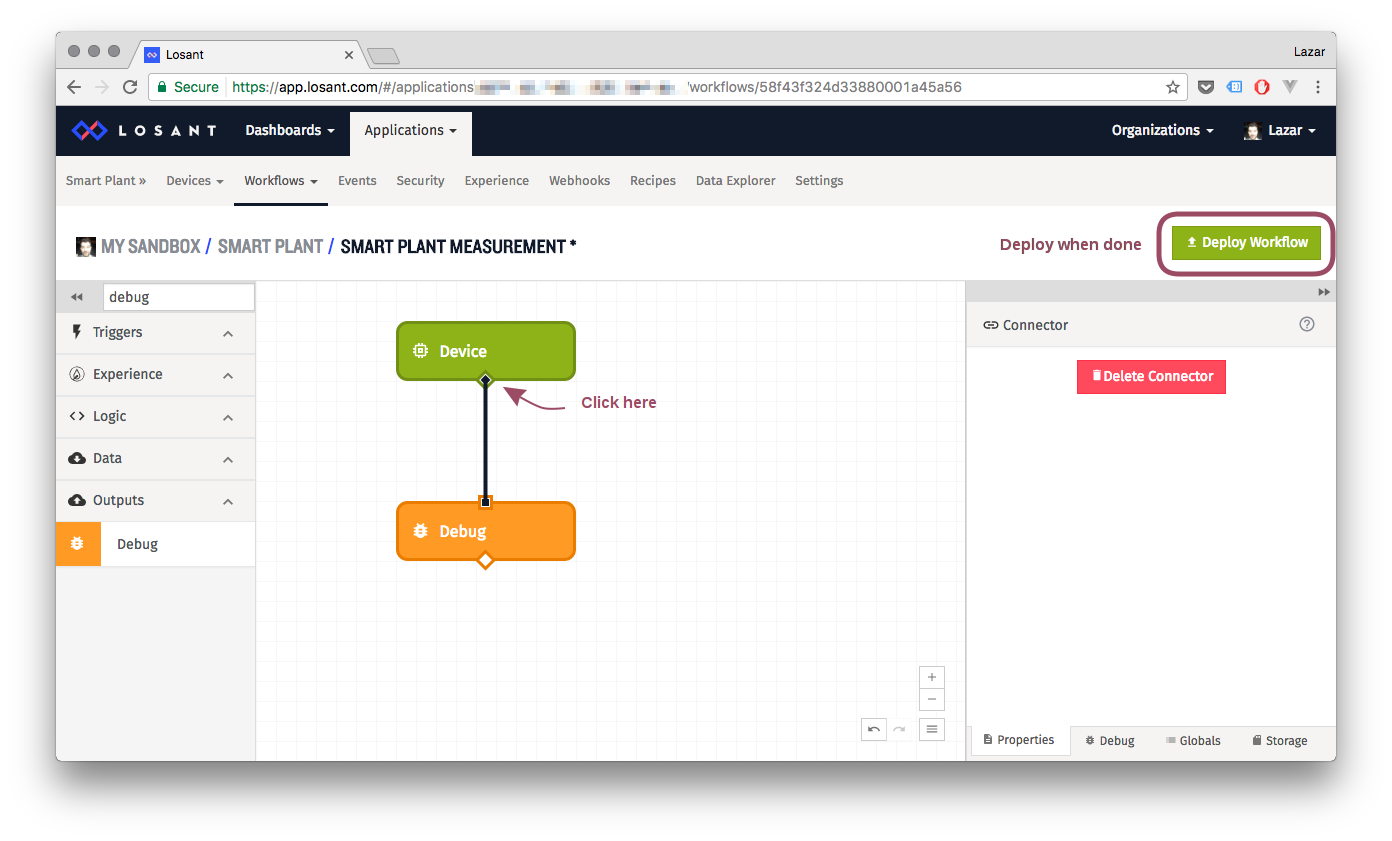
Your workflow is now saved and deployed, meaning that it’s running at this very moment on the cloud:
8. How does my Omega talk to Losant?
Glad you asked! There’s some additional software and configuration we need to do on the Omega to get it to report the soil moisture level to Losant on a regular basis. Behind the scenes, the Python script will be using MQTT to communicate with Losant.
If you haven’t completed the first part of the Smart Plant project, you need to go back and do it now before proceeding. The remainder of the steps assume that the smart-plant code can be found at /root/smart-plant on your Omega.
9. Install Required Software on the Omega
To install additional Python packages, we’ll need to install the Python package manager, PIP. Connect to the Omega’s Command line and run the following command:
opkg update
opkg install python-pip
Now that PIP is installed, we’ll first fix an issue with the setuptools module, and then install two modules.
pip install --upgrade setuptools
pip install paho-mqtt
pip install losant-mqtt
The paho-mqtt module provides MQTT functionality, and losant-mqtt provides an easy to use interface for connecting to Losant.
10. Setup Losant Credentials on Omega
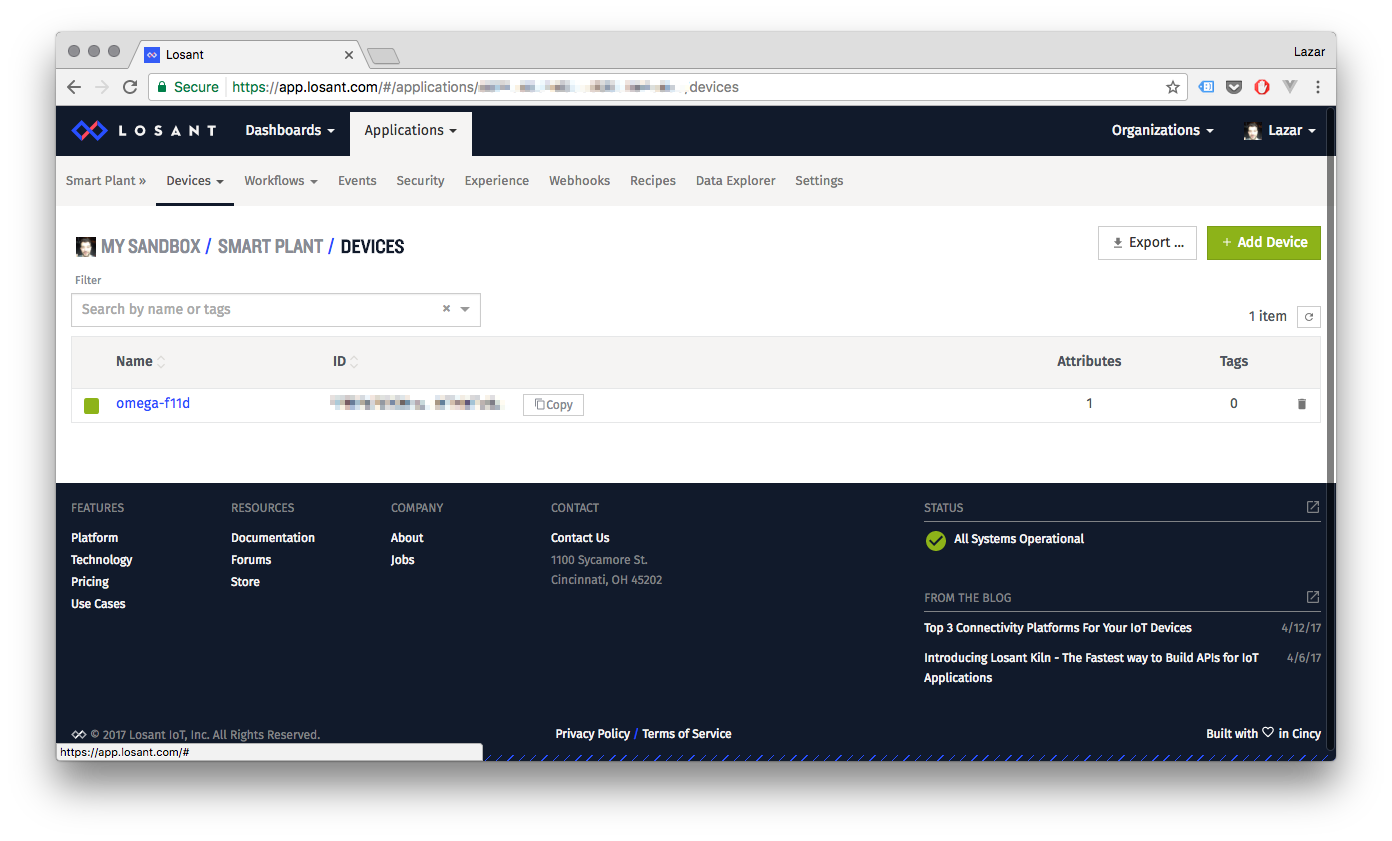
In order to connect and authenticate with Losant, the Smart Plant program will need to know the Device ID of your Losant Device, as well as your Access Key and Secret.
Look at your device on Losant to get the Device ID:
The Access Key and Secret you should have noted down somewhere when you created the Access Key. If you don’t have the Access secret noted down somewhere, you’ll have to create a new Access Key!
Now on your Omega, in the /root/smart-plant directory, there is a configuration file template called losant.json. Open it for editing and enter your deviceId, key, and secret to complete the setup.
11. Stop the Existing Program
In the first part of the project, we added a script to /etc/init.d to automatically run the smart plant program on boot. We’ll now need to stop the program before running it again manually.
Run the following command:
/etc/init.d/smart-plant stop12. Report the Smart Plant Data to Losant
Let’s try running the Smart Plant program with reporting to Losant enabled. We’re also providing the path to the Losant configuration file:
python /root/smart-plant/smartPlant.py --oled --quiet --losant /root/smart-plant/losant.jsonAssuming your Losant credentials are valid, you should see your device come online on Losant:
Going to the workflow, we can take a look at the Debug block’s Debug output to see the data coming from the Omega:
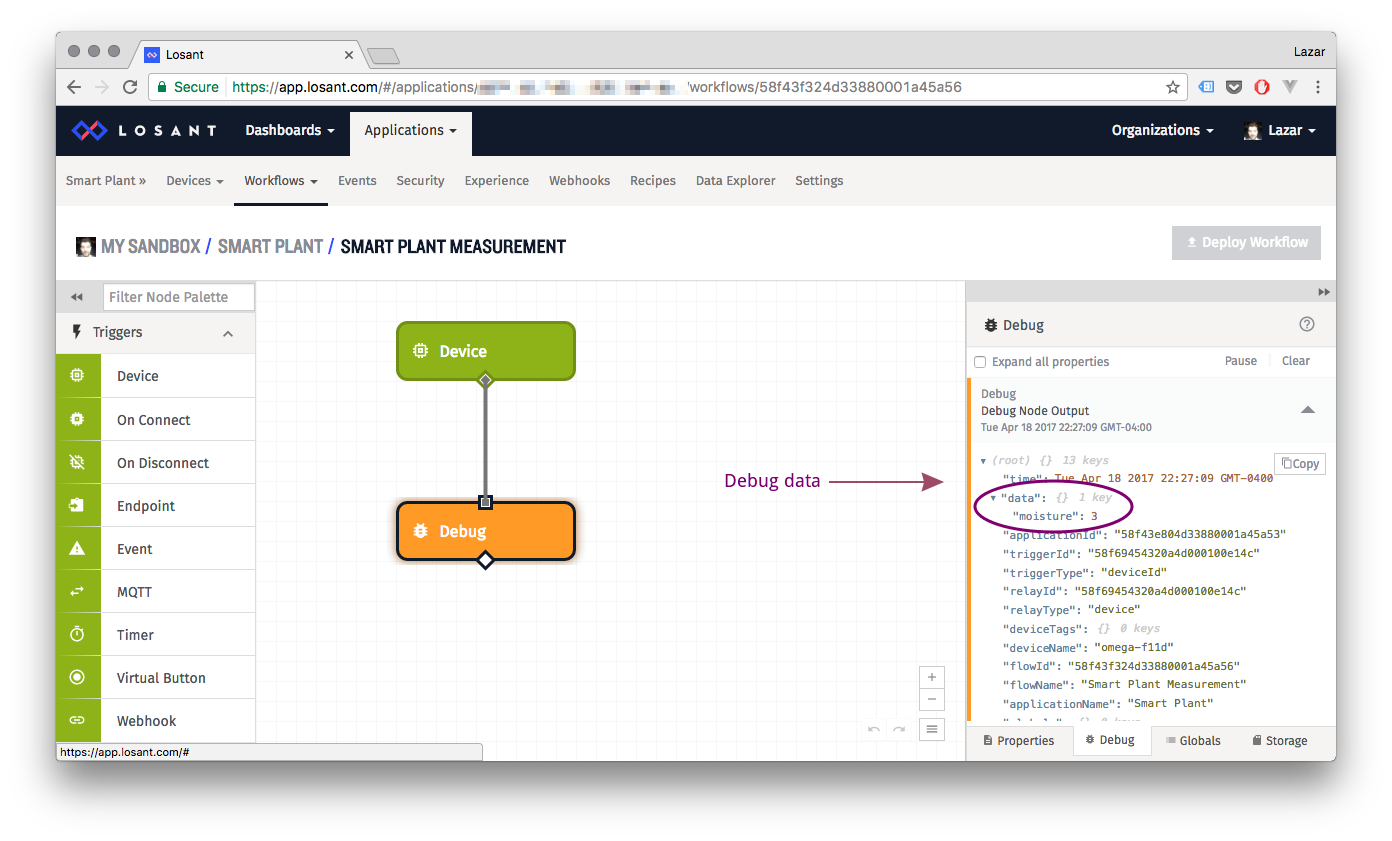
If you look at the Python code, you’ll see that what we send from the Omega is showing up in the debug window on Losant:
{
    "data" {
        "moisture": "<MOISTURE LEVEL READING>"
    }
}
Hit ctrl+c to stop the program.
13. Update Program Run at Boot
Since we now need to run the Smart Plant program with additional arguments to talk to Losant, we’ll need to update the /etc/init.d/smart-plant file.
Open the /etc/init.d/smart-plant file using the Vi editor: vi /etc/init.d/smart-plant. Hit i and use the arrow keys to navigate to the line that says BIN="usr/.... After the --quiet text, insert a space and type the following:
--losant /root/smart-plant/losant.jsonand insert a space between the json and the > character.
Your smart-plant file should now look like this:
#!/bin/sh /etc/rc.common
# Copyright (C) 2016 Onion Corporation
START=99

USE_PROCD=1
BIN="/usr/bin/python /root/smart-plant/smartPlant.py --oled --quiet --losant /root/smart-plant/losant.json > /dev/null 2>&1 &"

start_service() {
        procd_open_instance
        procd_set_param command $BIN
        procd_set_param respawn
        procd_close_instance
Hit esc and type :wq to save and close the file.
Then re-enable the program:
/etc/init.d/smart-plant restartTry rebooting your Omega (enter reboot in the command line), and you’ll see that your program will start up again when the Omega boots up.
14. Create a Losant Dashboard
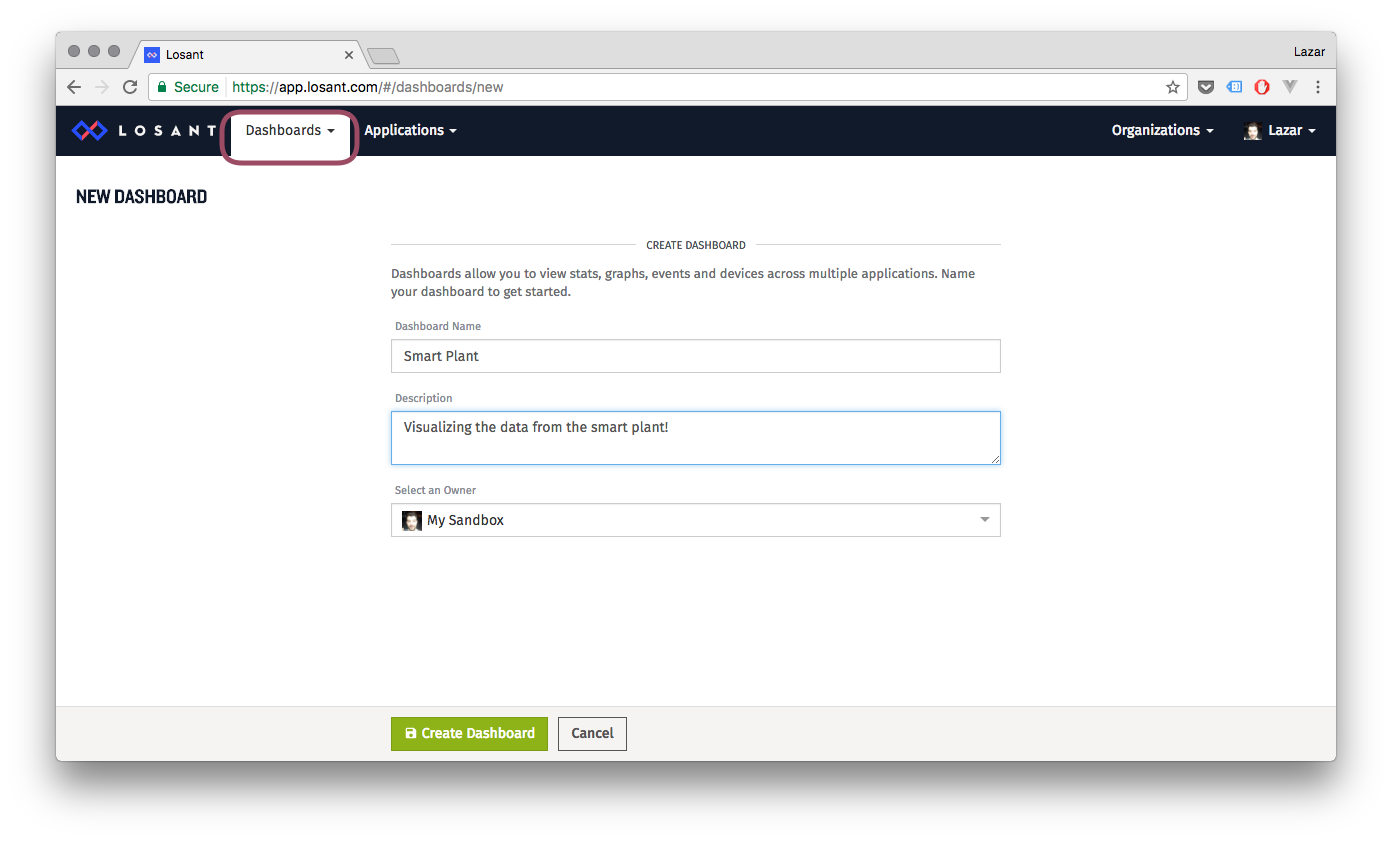
Now that we’ve successfully sent data to Losant, let’s create a Dashboard so we can easily check in on our plant and see how much moisture there is in the soil.
Click the Dashboards menu and then Create Dashboard, give your dashboard a name and description. Hit Create Dashboard:
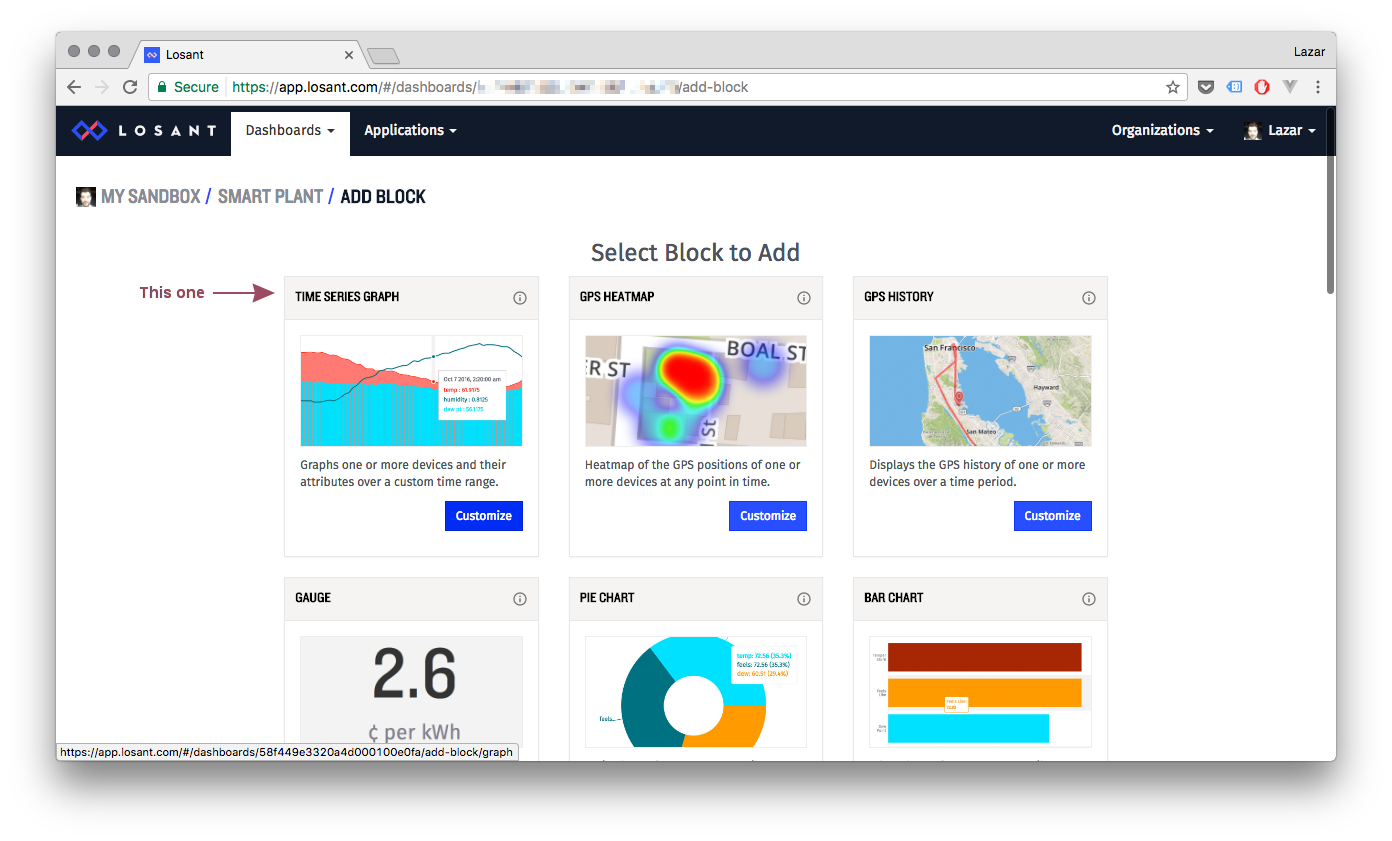
Let’s add a Time Series Graph to the dashboard:
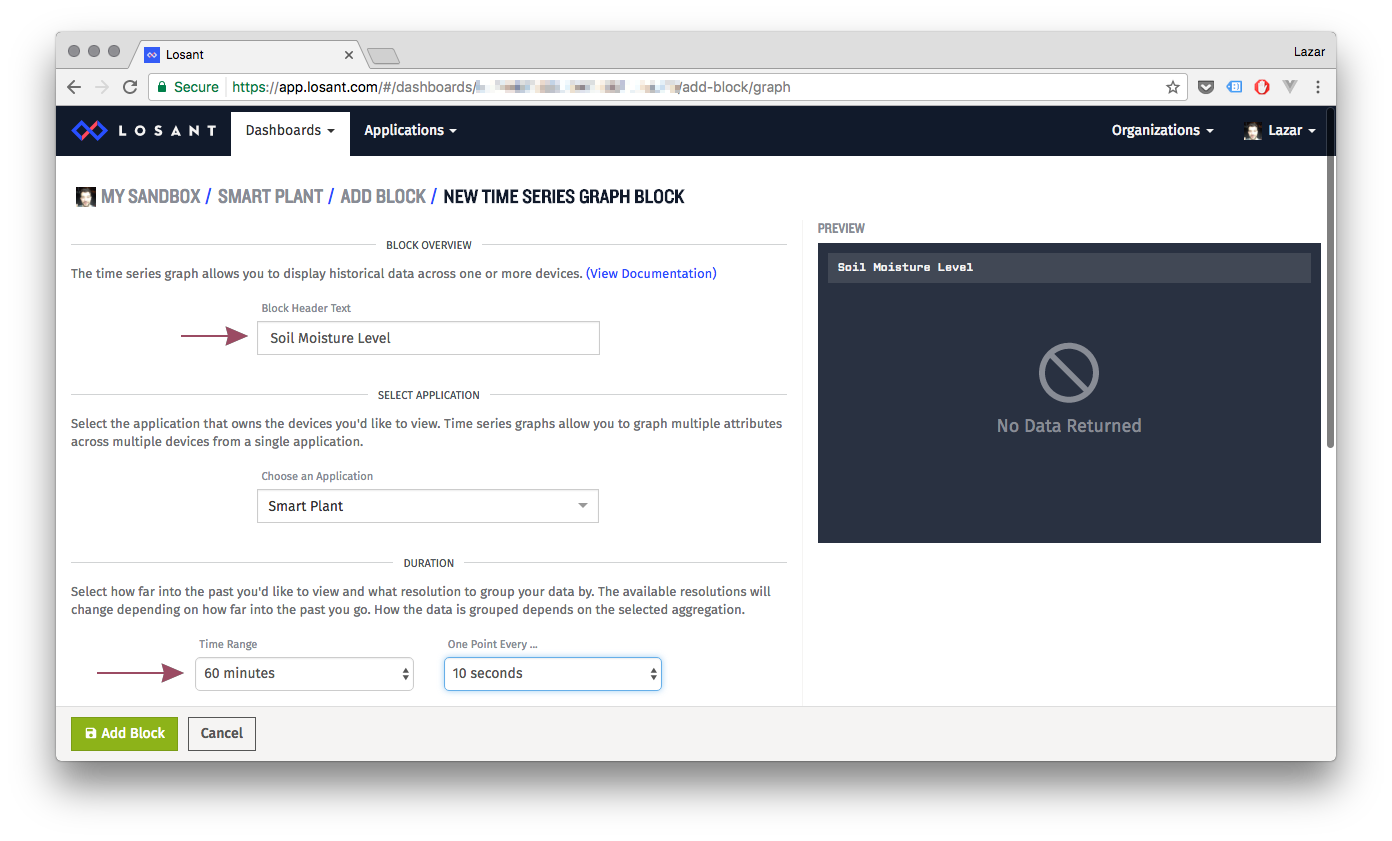
Give the block a Name and set the time range to 60 minutes and one point every 10 seconds:
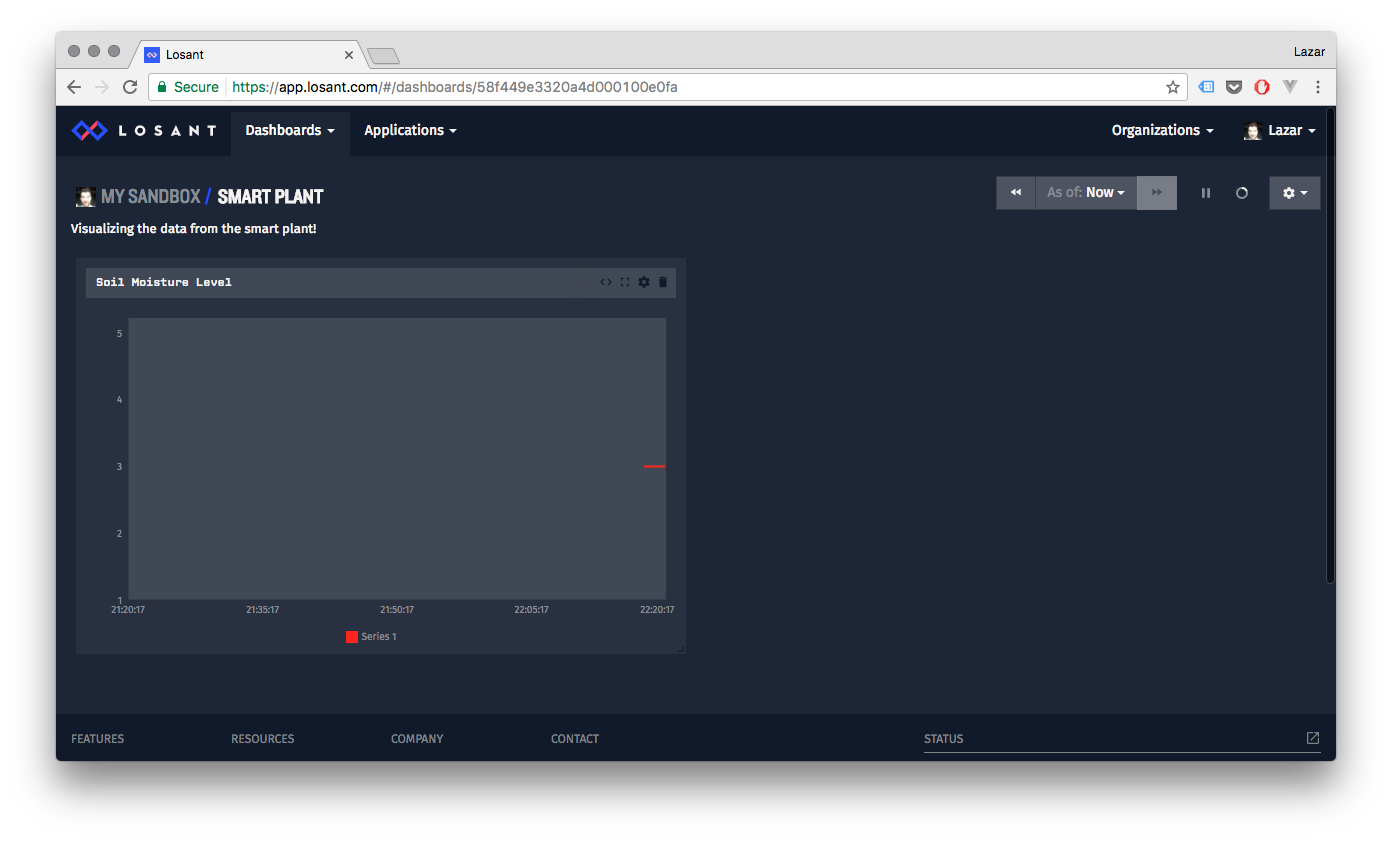
Scroll down to select your device from the Device IDs dropdown. Then select moisture from the Attribute dropdown:
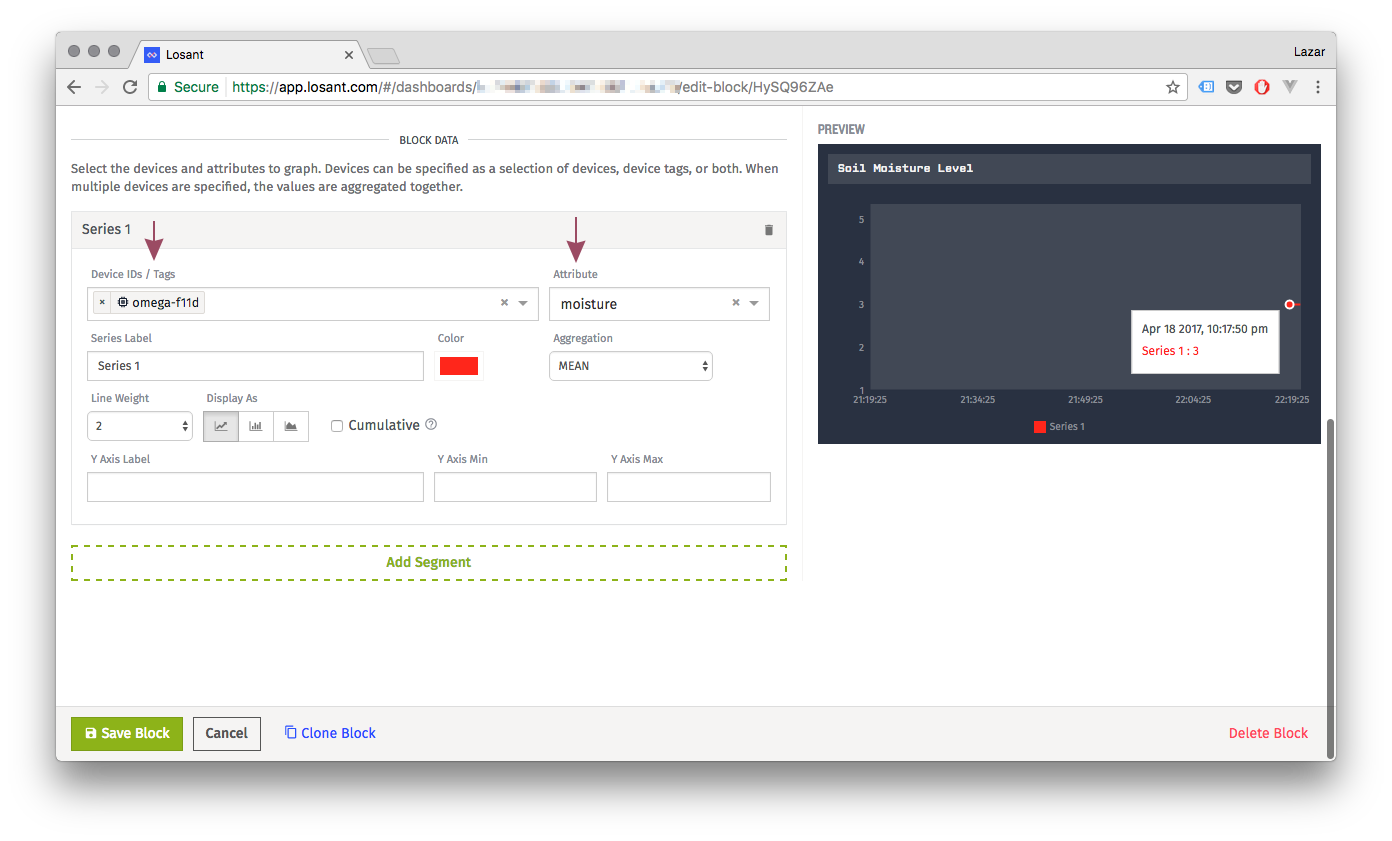
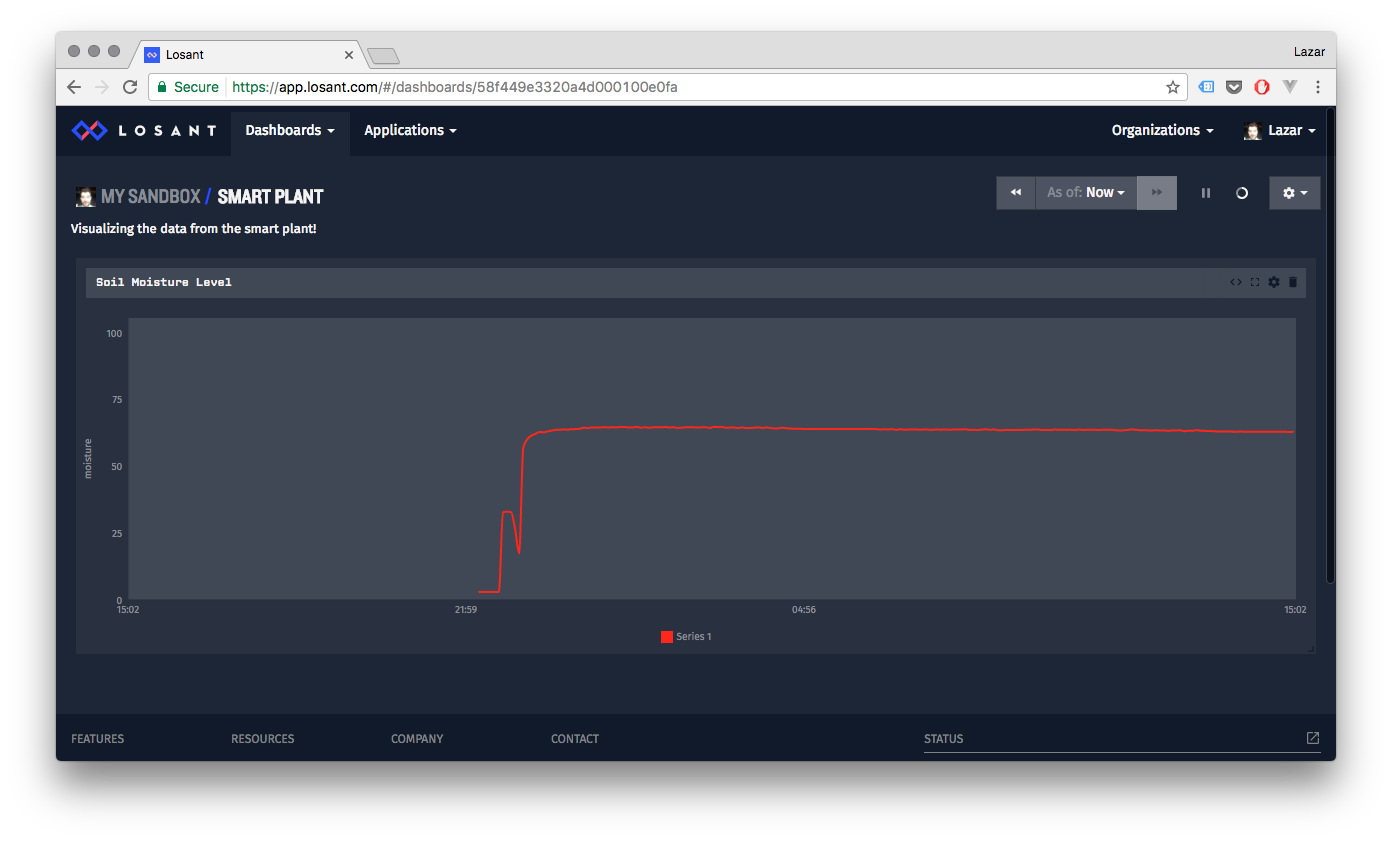
Awesome! Your dashboard is now displaying the soil moisture data being collected by your Omega:
15. Playing with the Dashboard
Try watering your plant a little while after you’ve setup the dashboard:
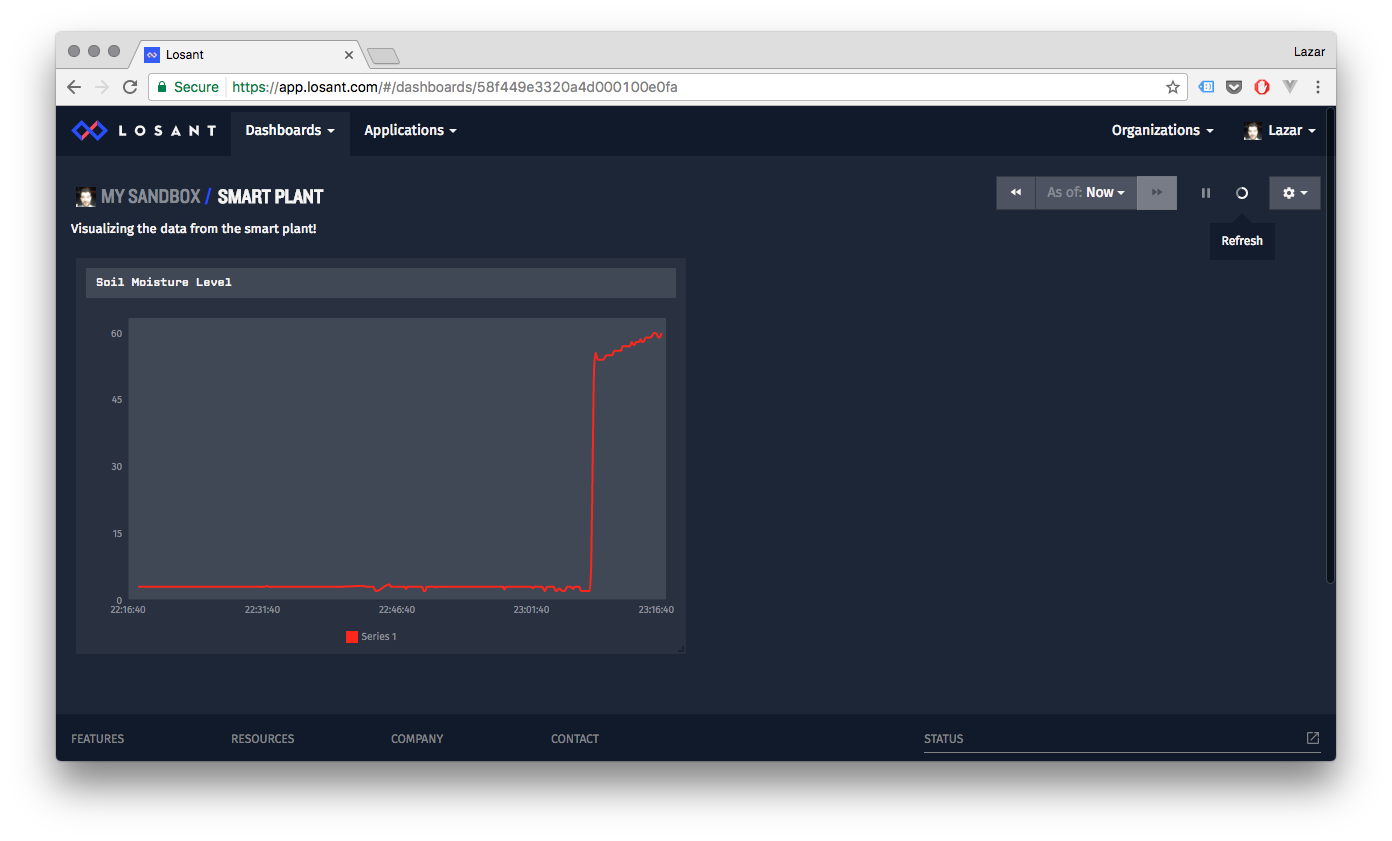
What a jump!
Adjusting the Y-Axis
You might have noticed that the Y-axis adjusted automatically to fit the data. Since we know our measured value is limited in the 0 to 100 range, we can adjust the graph.
Hover over the graph and click on the Gear icon. Scroll down and adjust the Y Axis Minimum to 0 and the Maximum to 100:
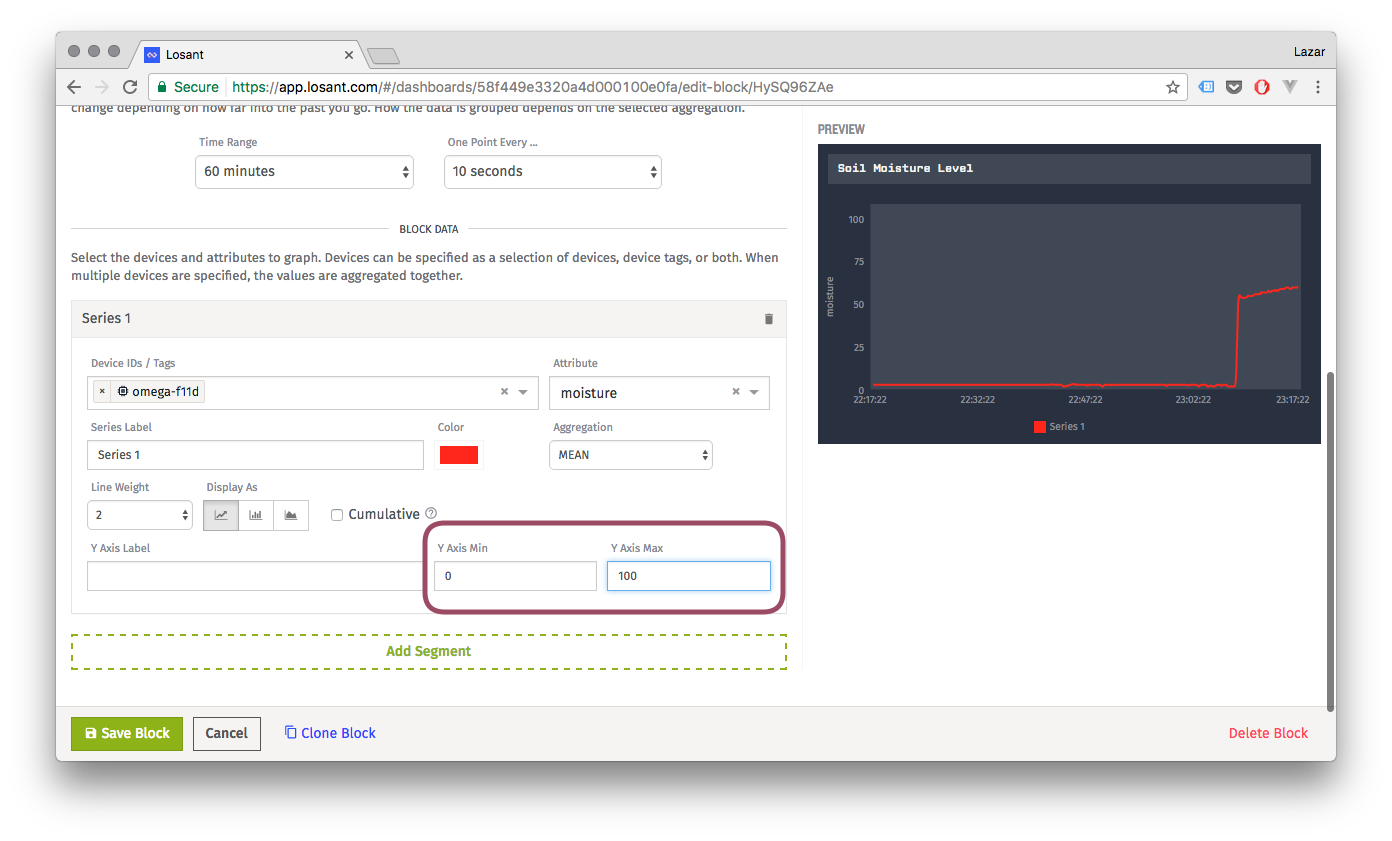
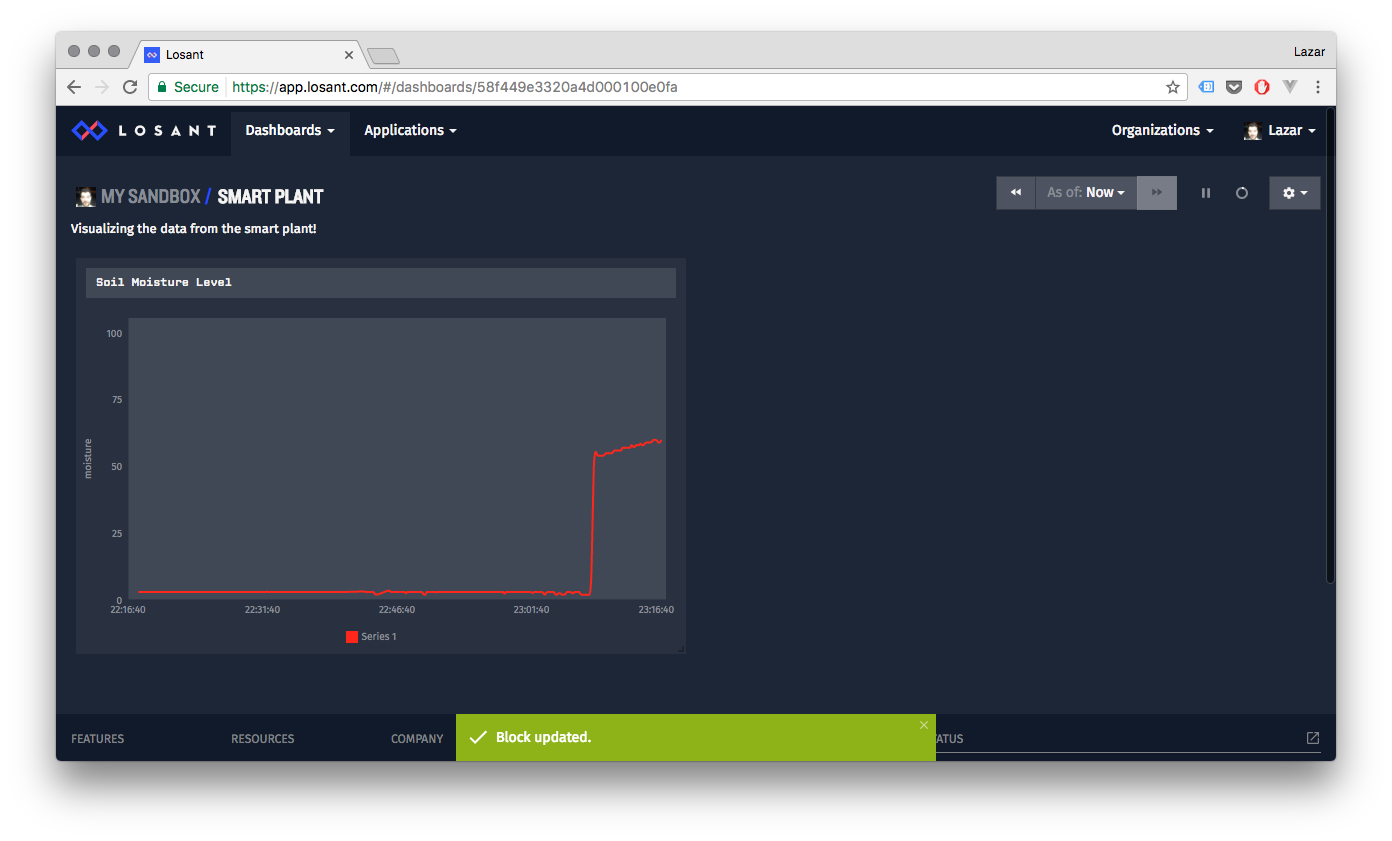
Hit Save Block and check out the chart now:
Changing the Time Range
Seeing just the last hour of our plant’s moisture level isn’t too helpful, so let’s change it to something more useful!
Hover over the chart and click the Gear icon. Adjust the Graph’s Time Range to 24 hours or more.
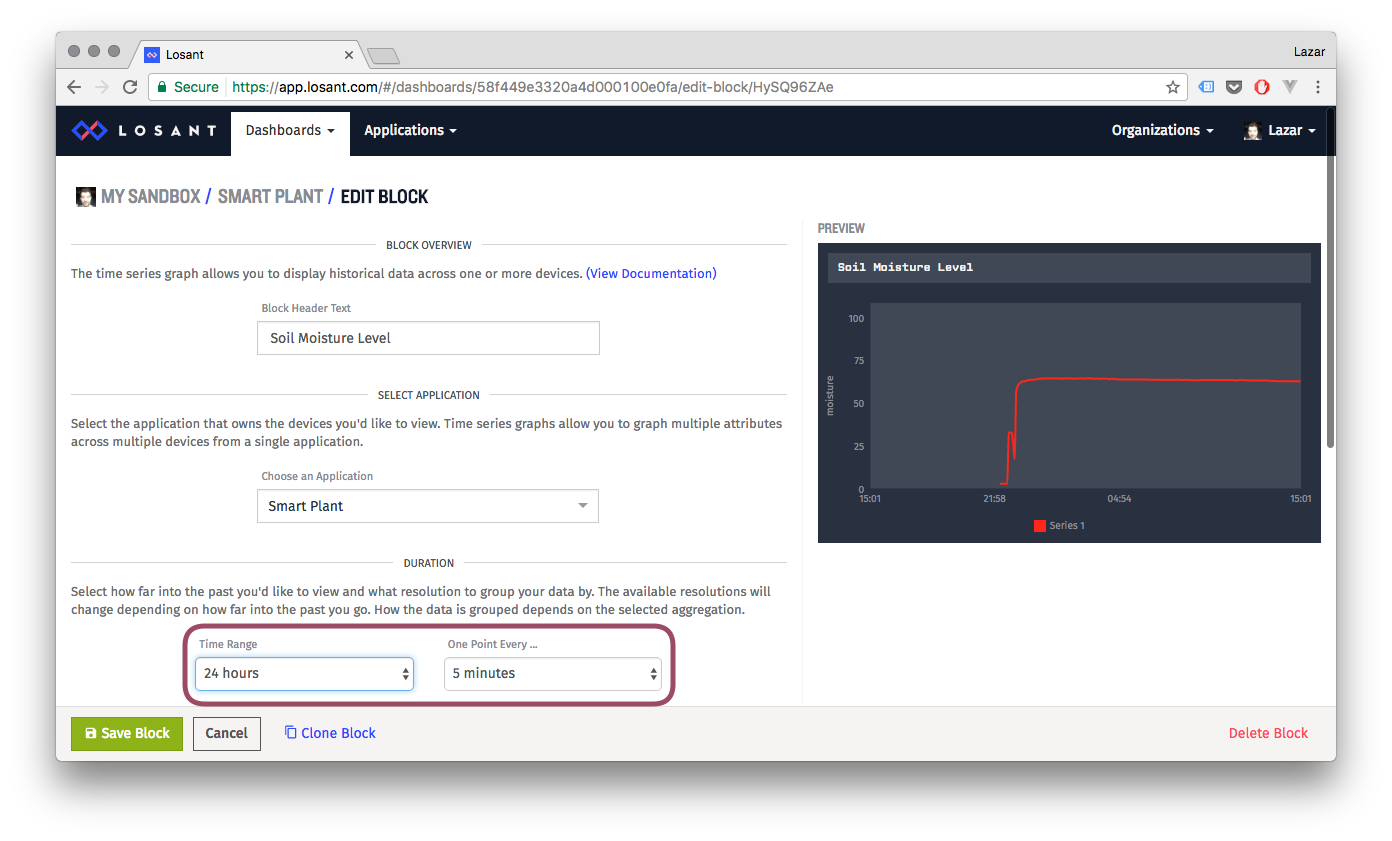
Hit Save Block and check out your extended chart. In this case, there was only data for the previous 18 hours, so everything before then is blank. If you have more data, a time range of many days might be more suitable:
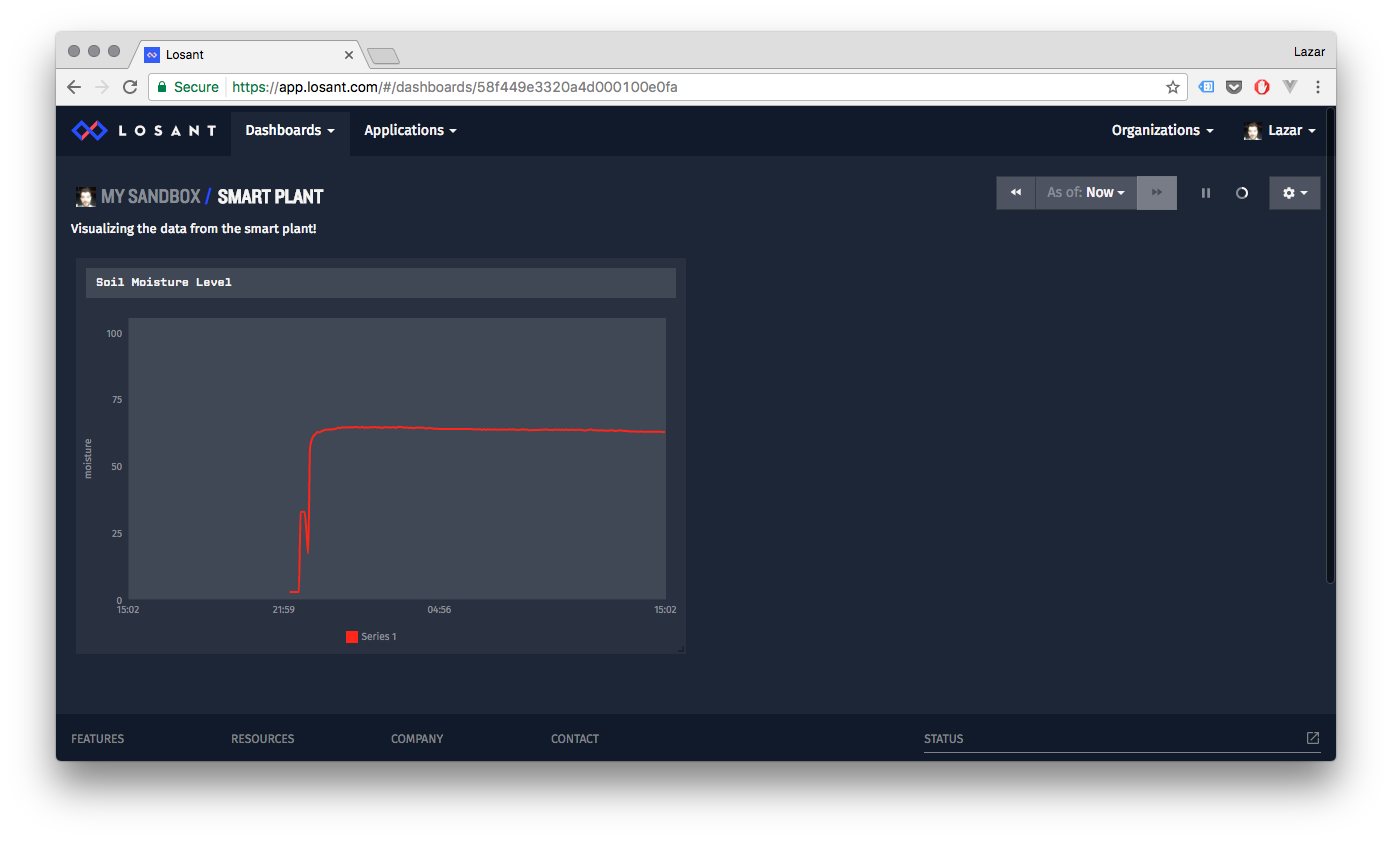
If you do want to display more data, it would be useful to have a larger chart! Hover over the chart and click and drag the icon to change the size:
Going Further
Next we’ll give our plant a voice of its own by connecting it to Twitter and having it broadcast to the world!